Book Chapter: Cyber Risk Quantification of Financial Technology
In February 2018, I wrote a chapter in a Risk.net book, titled Fintech: Growth and Deregulation. The book is edited by Jack Freund, who most of you will recognize as the co-author of Measuring and Managing Information Risk.
I happy to announce that I’m now able to re-post my book chapter, titled “Cyber-risk Quantification of Financial Technology” here. If you are interested in blockchain tech, Fintech, risk quantification and emerging risks, you may find it interesting. It’s also a primer to Factor Analysis of Information Risk (FAIR), one of many risk quantification models. It’s not the only one I use, but the one I use most frequently.
I covered the main ideas at the PRMIA Risk Management event in a talk titled Cybersecurity Aspects of Blockchain and Cryptocurrency (slides available in the link.)
You can buy the book here.
Hope you enjoy — and as always, if you have questions, comments or just want to discuss, drop me a line.
Chapter 13: Cyber Risk Quantification of Financial Technology
By Tony Martin-Vegue …from Fintech: Growth and Deregulation
Edited by Diane Maurice, Jack Freund and David Fairman
Published by Risk Books. Reprinted with permission.
Introduction
Cyber risk analysis in the financial services sector is finally catching up with its older cousins in financial and insurance risk. Quantitative risk assessment methodologies, such as Factor Analysis of Information Risk (FAIR), are steadily gaining traction among information security and technology risk departments and the slow, but steady, adoption of analysis methods that stand up to scrutiny means cyber risk quantification is truly at a tipping point. The heat map, risk matrix and “red/yellow/green” as risk communication tools are being recognized as flawed and it truly couldn’t come at a better time. The field’s next big challenge is on the horizon: the convergence of financial services and rapidly evolving technologies – otherwise known as Fintech – and the risks associated with it.
Fintech has, in many ways, lived up to the hype of providing financial services in a way that traditional firms have found too expensive, too risky, insecure or cost prohibitive. In addition, many Fintech firms have been able to compete with traditional financial services by offering better products, quicker delivery and much higher customer satisfaction. The rapid fusion of technology with financial services also signals a paradigm shift for risk managers. Many of the old rules for protecting the confidentiality, integrity and availability of information assets are being upended and the best example of this is how the defence-in-depth model is an outdated paradigm in some situations. For decades, sound security practices dictated placing perimeter defences, such as firewalls and intrusion detection systems around assets like a moat of water surrounding a castle; iron gates stopping intruders from getting in with defenders on the inside, at the ready to drop hot oil. This metaphor made sense when assets were deployed in this way; database server locked in a server rack in a datacentre, surrounded by a ring of protective controls.
In the mid-2000’s, cloud computing technologies became a household name and risk managers quickly realized that the old defensive paradigms no longer applied. If cloud computing blurs the line between assets and the network perimeter, technologies used in Fintech, such as blockchain, completely obliterate it. Risk managers adapted to new defensive paradigms in 2006, and the same must be done now. For example, the very notion of where data is stored is changing. In the defence-in-depth model, first line, second line and third line defenders worked under the assumption that we want to keep a database away from the attackers, and accomplish this using trust models such as role-based access control. New models are being deployed in Fintech in which we actively and deliberately give data and databases to all, including potential attackers, and rely on a radically different trust model, such as the distributed ledger, to ensure the confidentiality and integrity of data.
The distributed ledger and other emerging technologies in Fintech do not pose more or less inherent risk than other technologies, but risk managers must adapt to these new trust and perimeter paradigms to effectively assess risk. Many firms in financial services are looking to implement these types of technologies so that business can be conducted faster for the customer, cheaper to implement and maintain, and increase the security posture of the platform. If risk managers approach emerging technologies with the same defence-in-depth mentality as they would a client-server model, they have the possibility of producing a risk analysis that drastically overstates or understates risk. Ultimately, the objective of a risk assessment is to inform decisions, therefore we must fully understand the risks and the benefits of some of these new technologies emerging in Fintech, or it may be hard to realize the rewards.
This chapter will explore emerging risks, new technologies and risk quantification in the Fintech sector with the objective of achieving better decisions – and continuing to stay one step ahead of the behemoth banks. The threat landscape is evolving just as fast – and sometimes faster – than the underlying technologies and control environments. The best way to articulate risk in this sector is through risk quantification. Not only is risk quantification mathematically sounder than the softer, qualitative risk methodologies, but it enables management to perform cost-benefit analysis of control implementation and reporting of risk exposure in dollars, euros or pounds, which our counterparts in financial and insurance risk are already doing. The end result is an assessment that prioritises risk in a focused, defensible and actionable way.
Emerging Risks in Fintech
History has demonstrated repeatedly that new innovations breed a new set of criminals, eager to take advantage of emerging technologies. From lightning-fast micropayments to cryptocurrency, some companies that operate in the Fintech sector are encountering a renaissance in criminal activity that is reminiscent of the crime wave Depression-era outlaws perpetrated against traditional banks. Add an ambiguous regulatory environment and it’s clear that risk managers will be on the front line of driving well-informed business decisions to respond to these threats.
Financial services firms are at the forefront of exploring these emerging technologies. An example of this is blockchain technology designed to enable near real-time payments anywhere in the world. UBS and IBM developed a blockchain payment system dubbed “Batavia” and many participants have signed on, including Barclays, Credit Suisse, Canadian Imperial Bank of Commerce, HSBC, MUFG, State Street (Reuters 2017), Bank of Montreal, Caixabank, Erste Bank and Commerzbank(Arnold 2017). The consortium is expected to launch its first product in late 2018. Other financial services firms are also exploring similar projects. Banks and other firms find blockchain technology compelling because it helps improve transaction speed, security and increase transparency, hence strengthening customer trust. Financial regulators are also looking at the same technologies with a watchful eye; regulators from China, Europe and the United States are exploring new guidance and regulations to govern these technologies. Banks and regulators are understandably cautious. This is uncharted territory and the wide variety of possible risks are not fully known. This trepidation is justified as there have been several high-profile hacks in the banking sector, blockchain and Bitcoin.
Some emerging risks in Fintech are:
Bank Heists, with a new spin
The Society for Worldwide Interbank Financial Telecommunication, also known as SWIFT, provides a secure messaging for over 11,000 financial institutions worldwide(Society of Worldwide Interbank Financial Telecommunication 2017), providing a system to send payment orders. SWIFT, in today’s context, would be considered by many to be anything but “Fintech” – but taking into account it was developed in 1973 and considering the system was, up until recently, thought of as being very secure – it is a stellar example of financial technology.
In 2015 and 2016 dozens of banks encountered cyberattacks that lead to massive theft of funds, including a highly-publicised incident in which $81 million USD was stolen from a Bangladesh bank (Corkery 2016). The attacks were sophisticated and used a combination of compromised employee credentials, malware and a poor control environment (Zetter 2016)to steal the funds in a matter of hours. Later analysis revealed a link between the SWIFT hack and a shadowy hacking group, dubbed by the FBI as “Lazarus.” Lazarus is also suspected in the 2014 Sony Pictures Entertainment hack. Both hacks and Lazarus have been linked to North Korea government (Shen 2016). If attribution to North Korea is true, is it the first known instance in which a nation-state actor has stolen funds from a financial institution with a cyberattack. Nation-state actors, in the context of threat modelling and risk analysis, are considered to be very well-resourced, sophisticated, trained and operate outside the rule of law that may deter run-of-the-mill cybercriminals. As such, assume that nation-states can overcome any set of controls that are put in place to protect funds and data. State-sponsored attacks against civilian targets is a concerning escalation and should be followed and studied closely by any risk manager in Fintech. The SWIFT hacks are an example of how weaknesses in payment systems can be exploited again and again. The underlying SWIFT infrastructure is also a good case study in how Fintech can improve weak security in payment systems.
Forgetting the Fundamentals
Fintech bank heists aren’t limited to technology first developed in 1973, however. Take the case of the Mt. Gox Bitcoin heist: one of the first and largest Bitcoin exchanges at the time had 850,000 Bitcoin stolen in one day. At the time of the theft, the cryptocurrency was valued at $450 million USD. As of October 2017, the value of 850,000 Bitcoin is $3.6 trillion USD. How did this happen? Details are still murky, but the ex-CEO of Mt. Gox blamed hackers for the loss, others blamed the CEO, Mark Karpeles; the CEO even did time in a Japanese jail for embezzlement (O'Neill 2017). There were other issues, however: according to a 2014 story in Wired Magazine, ex-employees described a company in which there was no code control, no test code environment and only one person that could deploy code to the production site: the CEO himself, Mark Karpeles. Security fixes were often deployed weeks after they were developed (McMillian 2014). Fintech’s primary competitive advantage is that they have less friction than traditional financial services, therefore are able to innovate and push products to market very quickly. The downside the Mt. Gox case proves is when moving quickly, one cannot forget the fundamentals. Fundamentals, such as code change/version control, segregation of duties and prioritizing security patches should not be set aside in favour of moving quickly. Risk managers need to be aware of and apply these fundaments to any risk analysis and also consider that what makes technologies so appealing, such as the difficulty in tracing cryptocurrency, is also a new, emerging risk. It took years for investigators to locate the stolen Mt. Gox Bitcoin, and even now, there’s little governments or victims can do to recover them.
Uncertain regulatory environment
Fintech encompasses many technologies and many products, and as such, is subject to different types of regulatory scrutiny that vary by jurisdiction. One example of this ambiguous regulatory environment is the special Fintech Charter being considered by the Comptroller of the Currency (OCC), of the banking regulator in the United States. The charter will allow some firms to offer financial products and services without the regulatory requirements associated with a banking charter (Merken 2017). This may be desirable for some firms, as it will offer a feeling of legitimacy to customers, shareholders and investors. However, other firms may see this as another regulatory burden that stifles innovation and speed. Additionally, some firms that would like to have a Fintech charter may not have the internal IT governance structure in place to consistently comply with requirements. This could also result in future risk; loss of market share, regulatory fines and judgements and bad publicity due to a weak internal control environment.
It is beyond the scope of this chapter to convince the reader to adopt a quantitative risk assessment methodology such as Factor Analysis of Information Risk (FAIR), however, consider this: in addition to Fintech Charters, the OCC also released an “Advanced Notice of Proposed Rulemaking” on Enhanced Cyber Risk Management Standards. The need for improved cyber risk management was argued in the document, and FAIR Institute’s Factor Analysis of Information Risk standard and Carnegie Mellon’s Goal-Question-Indicator-Metric process are specifically mentioned (Office of the Comptroller of the Currency 2016). Risk managers in Fintech should explore these methodologies if their firm has a banking charter, may receive a special-purpose Fintech charter or are a service provider for a firm that has a charter.
Poor risk management techniques
We’re an emerging threat.
As mentioned many times previously, technology is rapidly evolving and so is the threat landscape. Practices, such as an ambiguous network perimeter and distributed public databases were once unthinkable security practices. They are now considered sound and, in many cases, superior methods to protect the confidentiality, integrity and availability of assets. Risk managers must adapt to these new paradigms and use better tools and techniques of assessing and reporting risk. If we fail to do so, our companies will not be able to make informed strategic decisions. One of these methods is risk quantification.
Case Study #1: Assessing risk of Blockchain ledgers
Consider a start-up payments company that is grappling with several issues: payments are taking days to clear instead of minutes; fraud on the platform exceeds their peers; and, a well-publicised security incident several years prior has eroded public trust.
Company leaders have started conversations around replacing the traditional relational database model with blockchain-based technology. Blockchain offers much faster payments, reduces the firm’s foreign exchange risk, helps the business improve compliance with Know Your Customer (KYC) laws, and reduces software costs. Management has requested a risk assessment on the different operating models of the blockchain ledger, expecting enough data to perform a cost-benefit analysis.
After carefully scoping the analysis, three distinct options have been identified the firm can take:
Stay with the current client-server database model. This does not solve any of management’s problems, but does not expose the company to any new risk either.
Migrate the company’s payments system to a shared public ledger. The trust model completely changes: anyone can participate in transactions, as long as 51% of other participants agree to the transaction (51% principle). Over time, customer perceptions may improve due to the total transparency of transactions, however, the question of securing non-public personal information (NPI) needs to be examined. Furthermore, by making a payments system available to the public that anyone can participate in, the firm may be reducing their own market share and a competitive differentiator needs to be identified.
The firm can adopt a private blockchain model: participation by invitation only, and in this case, only other payments companies and service providers can participate. This is a hybrid approach: the firm is moving from a traditional database to a distributed database, and the trust model can still be based on the 51% principle, but participation still requires authentication, and credentials can be compromised. Additionally, in some implementations, the blockchain can have an “owner” and owners can tamper with the blockchain.
It’s clear that this is not going to be an easy risk assessment, and the risk managers involved must do several things before proceeding. This is a pivotal moment for the company and make-or-break decisions will be based on the analysis, so red/yellow/green isn’t going to be sufficient. Second, traditional concepts such as defence-in-depth and how trust is established are being upset and adaptability is key. The current list of controls the company has may not be applicable here, but that does not mean the confidentiality, integrity and availability of data is not being protected.
Applying Risk Quantification to Fintech
Assessing risk in financial service, and in particular, Fintech, requires extra rigor. As a result, quantitative risk assessment techniques are being discussed in the cyber risk field. This chapter focuses on the Fair Institute’s Factor Analysis of Information Risk because it is in use by many financial intuitions world-wide, has many resources available to aid in implementation and is cited by regulators and used by financial institutions as a sound methodology for quantifying cyber risk (Freund & Jones, 2015). It’s assumed that readers do not need a tutorial on risk assessment, risk quantification or even FAIR; this section will walk through a traditional FAIR-based quantitative risk analysis that many readers are already familiar with and specifically highlight the areas where Fintech risk managers may need to be aware of, such as unique, emerging threats and technologies.
In FAIR, there are four distinct phases of an assessment: scoping the assessment, performing risk analysis, determining risk treatment and risk communication (Josey & et al, 2014). Each are equally important and have special considerations when assessing risk in Fintech.
Scoping out the assessment
Scoping is critical to lay a solid foundation for a risk assessment and saves countless hours during the analysis phase. An improperly scoped analysis may lead to examining the wrong variables or spending too much time performing an analysis, which is a common pitfall many risk managers make. Focus on the probable, not the possible (possibilities are infinite – is it possible that an alien invasion can affect the availability of your customer database by vaporizing your datacentre?)
Scoping is broken down into four steps: identifying the asset(s) at risk, identifying the threat agent(s) that can act against the identified assets, describe the motivation, and lastly, identify the effect the agent has on business objectives. See Figure 1 for a diagram of the process.
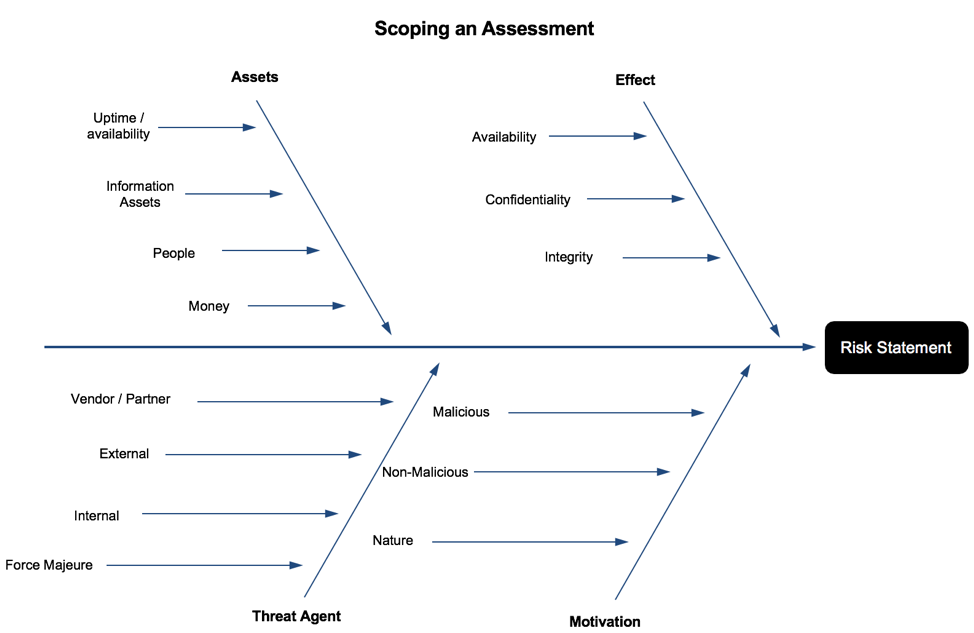
Figure 1: Scoping an Assessment
Step 1: Identify the asset(s) at risk
Broadly speaking, an asset in the cybersecurity sense is anything that is of value to the firm. Traditionally, hardware assets, such as firewalls, servers and routers are included in every risk analysis, but in Fintech – where much of the services provided are cloud-based and on virtual hardware, uptime/availability is an additional metric. Downtime of critical services can almost always be measured in currency. There are several other assets to consider: money (e.g. customer funds), information assets (e.g. non-public personal information about the customer) and people. People, as an asset, are almost always overlooked but should be included for the sake of modelling threats and designing controls, both of which can impact human life and safety. Keep in mind that each asset requires a separate analysis, so scope in only the elements required to perform an analysis.
Understanding emerging technologies that enable Fintech is a crucial part of a risk managers job. It’s relatively easy to identify the asset – what has value to a company – when thinking about the client-server model, datacentres, databases and currency transactions. This becomes difficult when assets are less tangible, such as a database operating under the client-server model, running on a physical piece of hardware. Less tangible assets are what we will continue to find in Fintech, such as, data created by artificial intelligence, distributed public ledgers and digital identities.
Step 2: Threat Agent Identification
Risk managers, in most cases, will need to break down threat agents further than shown in Figure 1, but the basic attributes that all threat agents possess are illustrated. More detail is given in the “Threat Capability” portion of this section.
All risk must have a threat. Think of a very old house that was built in 1880’s. It has a crumbling, brick foundation sitting on top of sandy dirt. Load-bearing beams are not connected to the ground. In other words, this house will fall like a house of cards if a strong earthquake were to hit the area. Some analysts would consider this a significant risk, and immediately recommend mitigating controls: replace the brick foundation with reinforced concrete, bolt the house to the new foundation and install additional vertical posts to load-bearing beams.
These controls are very effective at reducing the risk, but there is an important data point that the analyst hasn’t asked: What is the threat?
The house is in the US state of Florida, which is tied with North Dakota as having the fewest number of earthquakes in the continental US (USGS n.d.), therefore other sources of threat need to be investigated.
Without identifying the threat agent before starting a risk analysis, one may go through a significant amount of work just to find there isn’t a credible threat, therefore no risk. Even worse, the analyst may recommend costly mitigating controls, such as an earthquake retrofit, when protection from hurricanes is most appropriate in this situation.
There are generally two steps when identifying threat agents: 1) use internal and external incident data to develop a list of threats and their objectives, and 2) analyse those threats to ascertain which ones pose a risk to Fintech firms and how the threat agents may achieve their objectives.
Firms in the Fintech sector have many of the same threat agents as those that operate in Financial Services, with a twist: as the portmanteau suggests, Fintech firms often have threat agents that have traditionally targeted financial services firms, such as cybercriminal groups. Cyber criminals have a vast array of methods, resources and targets and are almost always motivated by financial gain. Financial services firms have also been targeted in the past by hacktivist groups, such as Anonymous. Groups such as this are motivated by ideology; in the case of Anonymous, one of their (many) stated goals was disruption of the global financial systems, which they viewed as corrupt. Distributed Denial of Service (DDoS) attacks are used to disrupt the availability of customer-facing websites, with some effect, but ultimately fail to force banks to enact any policy changes (Goldman 2016). Technology firms are also victims of cybercrime attacks, but unlike financial institutions, many have not drawn the ire of hacktivists. Depending on the type of technology a firm develops, they may be at an increased threat of phishing attacks from external sources and intellectual property theft from both internal and external threats.
Step 3: Describe the Motivation
The motivation of the threat actor plays is a crucial part in scoping out an analysis, and also helps risk managers in Fintech include agents that are traditionally not in a cyber risk assessment. For example, malicious agents include hostile nation-states, cybercriminals, disgruntled employees and hacktivists. As mentioned in the Emerging Risks in Fintech section earlier, risk managers would be remiss to not include Government Regulators as a threat agent. Consider Dwolla; the control environment was probably considered “good enough” and they did not suffer any loss events in the past due to inadequate security. However, government regulators caused a loss event for the company in the form of a fine, costly security projects to comply with the judgement and bad publicity. Additionally, consider accidental/non-malicious loss events originating from partners and third-party vendors, as many Fintech firms heavily rely on cloud-based service providers.
Step 4: Effect
Some things don’t change: security fundamentals are as applicable today as they were decades ago. Using the CIA Triad (confidentiality, integrity, availability) helps risk managers understand the form a loss event takes and how it affects assets. Threat agents act against an asset with a particular motivation, objective and intent. Walking through these scenarios – and understanding threat agents – helps one understand what the effect is.
Think about a threat agents’ goals, motivations and objectives when determining the effect. Hacktivists, for example, are usually groups of people united by political ideology or a cause. Distributed Denial of Service (DDoS) attacks have been used in the past to cause website outages while demands are issued to the company. In this case, the risk manager should scope in Availability as an effect, but not Confidentiality and Integrity.
Lastly: Writing Good Risk Statements
The end result is a well-formed risk statement that clearly describes what a loss event would look like to the organization. Risk statements should include all of the elements listed in steps 1-4 and describe the loss event, who the perpetrator is and what asset is being affected.
More importantly, the risk statement must always answer the question: What decision are we making? The purpose of a risk analysis is to reduce uncertainty when making a decision, therefore if at the end of scoping you don’t have a well-formed question that needs to be answered, you may need to revisit the scope, the purpose of the assessment or various sub-elements.
Case Study #2: Asset Identification in Fintech
A large bank has employed several emerging technologies to create competitive differentiators. The bank is moving to application programming interfaces (APIs) to move data to third parties instead of messaging (e.g. SWIFT). The bank is also employing a private blockchain and is innovating in the area of creating digital identities for their customers. A risk assessment of these areas requires inventive analysis to even complete the first step, asset identification.
When performing a risk analysis, the first question to ask is “What is the asset we’re protecting?” Besides the obvious, (money, equipment, data containing non-public personal information (NPI) firms that employ Fintech assets may often be less obvious. If the risk analyst is stuck, utilise information security fundamentals and break the problem down into smaller components that are simpler to analyse. In the case of the large bank employing new technologies, consider how the confidentiality, integrity and availability (CIA) can be affected if a loss event were to take place.
Confidentiality and integrity in a blockchain ledger can be affected if the underlying technology has a vulnerability. Blockchain technology was built from the ground up with security in mind using secret sharing; all the pieces that make up data are random and obfuscated. In a client-server model, an attacker needs to obtain a key to compromise encryption; with blockchains, an attacker needs to compromise the independent participant servers (depending on the implementation, this can be either 51% of servers or all the servers). The “asset” has shifted from something in a datacentre to something that is distributed and shared.
By design, blockchain technology improves availability.The distributed, decentralized nature of it makes it very resilient to outages. The asset in this case has also shifted; if uptime/availability is an asset due to lost customer transactions, this may not occur after the bank is done with the distributed ledger implementation. Risk may be overstated if this is not considered.
Case Study #3: Government regulators as a threat agent
In addition to the uncertain future with Fintech charters and the regulatory compliance risk it poses, the security practices of a US-based online payments platform start-up named Dwolla is also an interesting case study in regulatory action that results in a loss event. The Consumer Financial Protection Bureau (CFPB), a US-based government agency responsible for consumer protection, took action against Dwolla in 2016 for misrepresenting the company’s security practices. The CFPB found that “[Dwolla] failed to employ reasonable and appropriate measures to protect data obtained from consumers from unauthorized access” (United States Consumer Financial Protection Bureau 2016).
The CFPB issued a consent order and ordered the firm to remediate security issues and pay a $100,000 fine(Consumer Financial Protection Bureau 2016). This was the first action of this kind taken by the CFPB, which was created in 2014 by the Dodd-Frank Wall Street Reform and Consumer Protection Act. More interestingly, however, is that that action was taken without harm. Dwolla did not have a data breach, loss of funds or any other security incident. The CFPB simply found what the company was claiming about their implemented security practices to be deceptive and harmful to consumers. Risk managers should always build regulatory action into their threat models and consider that regulatory action can originate from consumer protection agencies, not just banking regulators.
Another interesting piece of information from the CFPB’s consent order is the discovery that “[Dwolla] failed to conduct adequate, regular risk assessments to identify reasonably foreseeable internal and external risks to consumers’ personal information, or to assess the safeguards in place to control those risks.” The risk of having incomplete or inadequate risk assessments should be in every risk manager’s threat list.
Performing the analysis
After the assessment is scoped, take the risk statement and walk through the FAIR taxonomy (figure 2), starting on the left.
Determine the Loss Event Frequency first which, in the FAIR taxonomy, is the frequency at which a loss event occurs. It is always articulated in the form of a period of time, such as “4x a month.” Advanced analysis includes a range, such as “Between 1x a month and 1x year.” This unlocks key features of FAIR that are not available in some other risk frameworks used in cyber risk: PERT distributions and Monte Carlo simulations. This allows the analyst to articulate risk in the form of ranges instead of a single number or colour (e.g. red.)
The Loss Event Frequency is also referred to as “Likelihood” in other risk frameworks. The Loss Event Frequency is a calculation of the Threat Event Frequency which is the frequency at which a threat agent acts against an asset, and the Vulnerability, which is a calculation of the assets’ ability to resist the threat agent. The Vulnerability calculation is another key differentiator of FAIR and will be covered in-depth shortly.
Loss Magnitude, sometimes called “Impact” in other risk frameworks, is the probable amount of loss that will be experienced after a loss event. The Loss Magnitude is comprised of Primary Loss, which is immediate losses, and Secondary Loss, which can be best described as fallout or ongoing, costs resulting from the loss event.
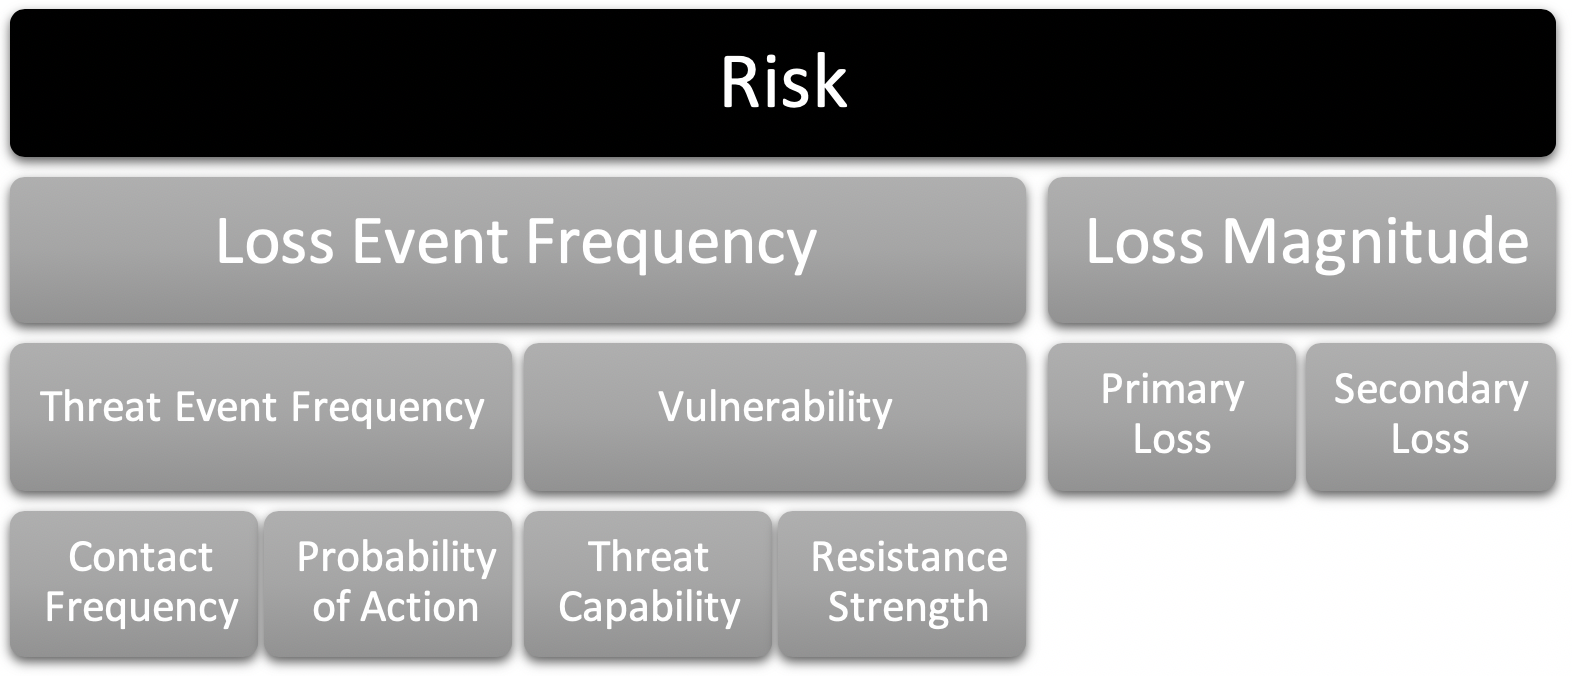
Figure 2: The FAIR taxonomy
Step 1: Derive the Threat Event Frequency
The scoping portion of the assessment includes a fair amount of work on threat agent modelling, so it is easiest to start there with the analysis. With the threat agent identified, the next step is to ascertain the frequency the threat agent will act against our asset.
FAIR also utilises calibrated probability estimates. When dealing with possible future events, it is not possible to say with exact certainty the frequency of occurrence. After all, we don’t have a crystal ball, nor do we need one. The purpose of a risk assessment is not to tell the future; it is to reduce uncertainty about a future decision. Calibrated probability estimates provide a way for subject matter experts to estimate probabilities while providing a means to express uncertainty. For example, a subject matter expert can state that a web application attack against a Fintech firm can occur between 1x a year and once every 5 years, with an 90% confidence interval. Confidence interval is a term used in statistics, meaning that the analyst is 90% certain the true answer falls within the range provided. Combining calibrated probability estimates with an analysis of past incidents, risk managers can be remarkably effective at forecasting a frequency of future threat events in a range.
Calibrated probability estimates have been used successfully in other fields for decades. Weather forecasts, for example, use calibrated probability estimates when describing the chance of rain within a period of time. Risk managers working in Fintech will find this method very effective because we are asked to describe risks that may not have happened before. In this case, a calibrated probability estimate allows the risk manager to articulate their level of uncertainty about a future event.
Contact Frequency describes the number of times a threat agent comes into contact with an asset and the Probability of Action describes the probability the threat agent will act against the asset.
Step 2: Derive the Vulnerability
Vulnerability is made up of two components: threat capability and resistance strength. These two concepts are usually discussed and analysed separately, but they are so intertwined with each other, that it may be easier to understand them as relational and even symbiotic (figure 3).
Threat Capability is a scale, between 1% and 100% given to a single agent in relation to the total population of threat agents that can cause loss events at your firm. The list of threat agents, often called a Threat Agent Library, can include everything from cyber criminals, nation states, hacktivists, natural disasters, untrained employees, government regulators and much more. Motivation, resources, objectives, organization and other attributes are considered when giving each agent a threat capability. The entire population of threat agents, with capability ratings, is called a threat continuum.
Resistance strength is also a percentage, between 1% and 100%, and is a way of measuring all the controls in place to protect an asset. The entire threat continuum is used as a benchmark to then give a range to how effective resistance strength is.
There are special considerations a Fintech risk manager must consider when assessing threat capability in a continuum and the corresponding resistance strength.
The threat landscape is constantly changing and evolving; think back to one of the first viruses that was distributed on the Internet, the Morris worm in 1988. A coding error in the virus turned something that was meant to be an experiment to measure the size of the Internet into a fast spreading worm that resulted in denial of service events on 10% of the Internet. Fast forward to today and the Morris worms seems quaint in retrospect. Militaries train cyber warriors for both offensive and defensive capabilities. Cyber-criminal organizations are highly resourced, develop their own tools, and have a very high level of sophistication. The CIA and NSA have developed offensive tools that, in many ways, outpace commercially available defensive products. In what is now called the Shadow Brokers leaks, those tools were made available to the public, giving threat actors a set of tools that give unprecedented offensive capabilities.
How does a risk manager measure and articulate a complex threat landscape that has the following attributes?
Nation states have vast resources, operate outside the law, develop exploits in where vendors do not have a patch for (zero day exploits), and launch offensive attacks at each other, resulting in collateral damage to firms.
Hostile nation states have attacked firms with the objective of damaging the company or stealing money.
Zero day exploits have been leaked and cyber-criminal organizations use them unhampered until vendors release a fix, which takes weeks or months.
Rewards for criminal activity have never been greater; monetizing stolen personal information from data breaches is easy and rarely results in legal repercussions
The threat landscape is a constant ebb and flow: there may be an elevated state of activity due to a hostile nation state launching attacks or exploits tools released into the wild. There may also be a period of relative calm, such as when most vendors release patches for Shadow Brokers exploits and firms have applied them.
Not all risk models include an assessment of threat capability, favouring an assessment of the control environment exclusively to determine the likelihood of a loss event. These models miss an important attribute of assessing cyber risk: the likelihood of a loss event growing and shrinking due to external forces, even if the control environment stays exactly the same. To understand this concept, one must understand the relationship between threat actors and controls.
A control is an activity that prevents or detects events that result in risk. Controls can be preventative, detective, corrective, deterrent, aid in recovery and compensating. Other disciplines, such as IT Audit, consider controls as something that operate in a vacuum: they are designed to perform a function, and they either operate effectively or they do not. For example, if we designed a flimsy door to be secured with a single lock on the door knob and tested the control, it would pass – as long as the door was locked. The threat actor (burglar with a strong leg to push the door in) is not considered. Control testing has its place in the enterprise, but is not effective at articulating risk.
Rather than thinking about controls by themselves, consider the entire control environment as the ability to resist threat agents. In fact, it is for this reason FAIR calls this portion of the risk assessment resistance strength – it’s a holistic view of an ability of an asset to resist the force of a threat agent.
Work with your threat teams to develop a threat actor library. It will help you scope out a risk assessment, is reusable, pre-loads much of the work upfront, therefore making risk assessments faster. Plot actors on a threat continuum diagram to make resistance strength identification easier and update at least quarterly.
Step 3: Derive Loss Magnitude
Understanding Loss Magnitude, the damage, expenses and harm resulting from an event, is often one of the easier portions of a risk analysis because other employees in a typical firm have thought about many of these expenses, although not in the context of cyber risk. Many risk frameworks refer to this step as “Impact.” Loss magnitude is made up of two components: Primary Loss, direct cost and damages, and Secondary loss, which is best thought of as “fallout” after an event.
Some considerations for Fintech risk managers when determining the Loss Magnitude:
Productivity can be harmed if an event hampers revenue generation. Emerging technologies, such as artificial intelligence, highly resilient network and distributed ledgers can mitigate some of this risk, but risk may present itself in different ways. Business Continuity managers and department heads of product lines are good places to start ascertaining this.
Response costs can add up quickly managing a loss event, such as employing outside forensics, auditors, staff augmentation and legal consulting.
The cost of replacing an asset still exists, even with cloud computing and virtual machines that can be allocated in minutes. There may be costs involved for extra computing capacity or restoring from backup.
Fines and judgements may occur when regulatory agencies take action against the firm of or judgements from lawsuits from customers, shareholders or employees. The legal landscape can be understood by reading the SEC filings of similar firms, news reports and legal documents. Action in this category is mostly public and is easy to extrapolate to apply to a particular firm.
Competitive advantage describes loss of customer and/or revenue due to a diminished company position after a loss event. This takes many forms, including the inability to raise new capital, inability to raise debt financing and a reduction in stock price. Senior management may have this information and an estimate of the number of lost customers due to an event.
Reputation damage resulting from a loss event can be difficult to quantify, but calibrated estimates can still be made. Focus on the tangible losses that can occur rather than “reputation.” For example, if in the long-term, perceptions about the company are negatively changed, this can result in a reduction in stock price, lenders viewing the company as a credit risk, reduction in market growth and difficulty in recruiting/retaining employees.
Final Steps: Deriving, Reporting and Communicating Risk
The final steps in the risk assessment are beyond the scope of this chapter, which focuses on Fintech, emerging risks and special considerations for risk managers. The final risk is a calculation of the Loss Event Frequency and the Primary/Secondary Loss, and is articulated in the form of a local currency. It is in this phase that the risk manager works with stakeholders to identify additional mitigating controls, if applicable, and another analysis can be performed to determine the expected reduction in loss exposure. Risk reporting and communication is a crucial part of any analysis: stakeholders must receive the results of the analysis in a clear and easy to understand way so that informed decisions can be made.
Case Study #4: Poor research skews Threat Event Frequency
Supplementing calibrated probability estimates with internal incident data and external research is an effective way to improve accuracy and control bias when conducting risk assessments, particularly the Threat Event Frequency portion of an analysis.
A medium-sized London-based insurance firm is conducting cutting-edge research in the machine learning and cryptocurrency areas, with the hope that they will be able to offer more products at very competitive prices. Management is concerned with the threat of insiders (company employees, consultants and contractors) stealing this innovative work and selling it to competitors. The cyber risk management team is tasked with ascertaining the risk to the company and determine how the current security control environment mitigates this risk. After careful scenario scoping, the team proceeds to the Threat Event Frequency portion of the analysis and encounters the first problem.
The company hasn’t had any security events involving insiders, so internal historical data isn’t available to inform a calibrated probability estimate. Additionally, subject matter experts say they can’t provide a range of a frequency of threat agents acting against the asset, which is intellectual property, because they are not aware of an occurrence in the Fintech space. The cyber risk team has decided to cast a wider net and incorporate external research conducted by outside firms on insider threats and intellectual property theft and extrapolate the results and use it to inform the risk scenario under consideration. It is at this point that the risk team encounters their next problem: the research available is contradictory, sponsored by vendors offering products that mitigate insider threats and uses dubious methodology.
There is no better example of how poor research can skew risk analysis than how insider threats have been researched, analysed and reported. The risk managers at the insurance firm need to estimate the percentage of data breaches or security incidents caused by insiders and have found several sources.
The Clear Swift Insider Threat Index report reports that 74% of data breaches are caused by insiders (Clearswift 2017).
In contrast, the 2017 Verizon Data Breach Investigation Report puts the number at 25% (Verizon 2017).
The IBM Xforce 2016 Cyber Security Intelligence Index reports that 60% of data breaches are caused by insiders, but a non-standard definition of “insider” is used (IBM 2016). IBM considers a user clicking on a phishing email as the threat-source, whereas most threat models would consider the user the victim and sender/originator of the email as the threat agent.
The lesson here is to carefully vet and normalize any data sources. Failure to do so could significant underreport or over report risk, leading to poor decisions.
All analysis and research have some sort of bias and error, but risk managers need to be fully aware of it and control for it, when possible, when using it in risk assessments. Carefully vet and normalize any data sources - failure to do so could result in significantly underreporting or over reporting threat event frequency.
A good source of incident data is the Verizon Data Breach Investigations Report (DBIR). The DBIR uses real-world incident data from reported data breaches and partners that span sectors: government, private sector firms, education and many others. The DBIR uses statistical analysis to present information to the reader that can be easily consumed into risk analysis. Another great source of raw incident data is the Privacy Rights Clearinghouse, which maintains a database of data breaches in the United States. Basic analysis is performed, but risk managers can download all incident data into Microsoft Excel and run their own analysis. Simple analysis is useful, such as the number of data breaches in the last 5 years due to stolen equipment, and more sophisticated analysis can be run, such as Bayesian analysis to generate a probability distribution.
Other security research is derived from Internet-based surveys and sometimes uses dubious methodologies often conducted without a notion of statistical sampling or survey science. Unless your risk analysis includes opinion about a population of people (many risk analyses can include this with great effectiveness!) it is best to read disclosures and research the methodology sections of reports to ascertain whether or not the research analysed a survey of respondents or actual incident data. The latter is almost always preferable when trying to determine frequency and probability of attacks and attack characteristics.
Risk managers should proceed with extreme caution when quoting research based on surveys. The importance of vetting research cannot be overstated.
Conclusion
Financial technology opens up new doors, in many ways. It enables disruption in a sector that is ripe for it and offers consumers more choices, often for cheaper and more securely. These new doors also require a shift in thinking for risk managers. Some of the old rules have changed and building fortress-like defensive security perimeters either don’t apply or hamper innovation. Conversely, some security fundamentals, such as the basics of how controls are applied and the security objectives of confidentiality, integrity and availability have not changed.
While Fintech has diverged from and in many ways outpaced its parent industry, Finance, in consumer offerings, speed and innovation, it must be careful not to rely on the same security tools that its other parent, Technology, has traditionally relied on. In doing so Fintech risk will in effect remain in the dark ages. Risk managers in modern finance have relied on quantitative methods to analyse business risk for as long as the industry has existed, whereas Technology still largely relies on the “red/yellow/green” paradigm to discuss risk. Fintech risk managers have an opportunity to further the rigor and integrity of our profession by using quantitative methods fitting of our trade. The future - including technology, the regulatory environment and the sophistication of criminals - continues to evolve, so we must equip ourselves with the tools that will support us to keep pace.
Quantitative risk assessments, such as FAIR, are how we are going to best serve our firms, analyse risk and advise on the best return on investment for security controls.
Works Cited
Arnold, Martin. 2017. Banks team up with IBM in trade finance blockchain.4 October. Accessed October 6, 2017. https://www.ft.com/content/7dc8738c-a922-11e7-93c5-648314d2c72c.
Clearswift. 2017. Clearswift Insider Threat Index.Accessed October 1, 2017. http://pages.clearswift.com/rs/591-QHZ-135/images/Clearswift_Insider_Threat_Index_2015_US.pdf.
Consumer Financial Protection Bureau. 2016. CFPB Takes Action Against Dwolla for Misrepresenting Data Security Practices.2 March. https://www.consumerfinance.gov/about-us/newsroom/cfpb-takes-action-against-dwolla-for-misrepresenting-data-security-practices/.
Corkery, Michael. 2016. Once Again, Thieves Enter Swift Financial Network and Steal.12 May. Accessed June 27, 2017. https://www.nytimes.com/2016/05/13/business/dealbook/swift-global-bank-network-attack.html.
Freund, J., & Jones, J. (2015). Measuring and Managing Information Risk: A FAIR Approach.Walthan, MA, USA: Elsevier.
Goldman, David. 2016. Anonymous attacks Greek Central Bank and vows to take down more banks' sites.4 May. Accessed July 4, 2017. http://money.cnn.com/2016/05/04/technology/anonymous-greek-central-bank/index.html.
IBM. 2016. IBM Xforce 2016 Cyber Security Intelligence Index .Accessed May 5, 2017. https://www.ibm.com/security/data-breach/threat-intelligence-index.html.
Josey, A., & et al. (2014). The Open FAIR Body of Knowledge.Berkshire, UK: The Open Group.
McMillian, Robert. 2014. The Inside Story of Mt. Gox, Bitcoin's $460 Million Disaster.3 March. https://www.wired.com/2014/03/bitcoin-exchange/.
Mead, Rebecca. 2016. Learn Different.7 March. Accessed August 9, 2017. https://www.newyorker.com/magazine/2016/03/07/altschools-disrupted-education.
Merken, Sara. 2017. OCC Not Yet Ready to Offer Special Charters to Fintechs.03 September. Accessed September 14, 2017. https://www.bna.com/occ-not-yet-n57982087846/.
Office of the Comptroller of the Currency. 2016. Enhanced Cyber Risk Management Standards.Office of the Comptroller of the Currency, Washington, D.C.: United States Department of the Treasury.
O'Neill, Patrick Howeell. 2017. The curious case of the missing Mt. Gox bitcoin fortune.21 June. https://www.cyberscoop.com/bitcoin-mt-gox-chainalysis-elliptic/.
Reuters. 2017. Six big banks join blockchain digital cash settlement project.31 August. Accessed October 6, 2017. https://www.reuters.com/article/us-blockchain-banks/six-big-banks-join-blockchain-digital-cash-settlement-project-idUSKCN1BB0UA.
Shen, Lucinda. 2016. North Korea Has Been Linked to the SWIFT Bank Hacks.27 May. Accessed October 1, 2017. http://fortune.com/2016/05/27/north-korea-swift-hack/.
Society of Worldwide Interbank Financial Telecommunication. 2017. Introduction to SWIFT.Accessed October 1, 2017. https://www.swift.com/about-us/discover-swift?AKredir=true.
United States Consumer Financial Protection Bureau. 2016. Consent Order Dwolla Inc.02 March. Accessed July 02, 2017. http://files.consumerfinance.gov/f/201603_cfpb_consent-order-dwolla-inc.pdf.
USGS. n.d. USGS.Accessed September 1, 2017. https://earthquake.usgs.gov/learn/topics/megaqk_facts_fantasy.php.
Verizon. 2017. Verizon Data Breach Investigations Report.Accessed July 4, 2017. http://www.verizonenterprise.com/verizon-insights-lab/dbir/2017/.
Zetter, Kim. 2016. That Insane, $81M Bangledesh Bank Heist? Here's what we know.17 May. Accessed July 4, 2017. https://www.wired.com/2016/05/insane-81m-bangladesh-bank-heist-heres-know/.