
The Risk Riddle: Why False Precision Breaks Risk Management
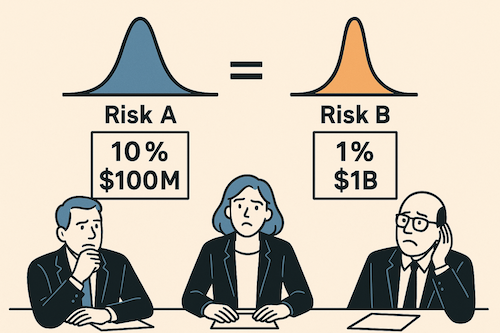
Two risks with identical $10M annualized loss leave leadership frozen like Buridan’s Ass, unable to choose between options that look mathematically equal. The paralysis disappears once you move beyond point estimates and acknowledge uncertainty, tail risk, and control, revealing that the risks were never truly the same.
The leadership team is deadlocked. Two risks, both representing $10M in annual expected loss, yet they can't agree on priorities. It's a modern version of Buridan's Ass: the philosophical paradox where a donkey starves between two equally appealing piles of hay, unable to choose.

A donkey, paralyzed between equal choices, dies from indecision; a paradox posed by philosopher Jean Buridan.
But here's the twist: these risks aren't actually identical. When we break it down a little further, we see:
Risk A: Data breach with 10% annual probability and $100M impact
Risk B: Regulatory shutdown with 1% annual probability and $1B impact
The math is identical. Both represent $10M in annualized risk. Yet watch what happens when you ask different stakeholders which risk keeps them up at night.
The Predictable Split
The CEO immediately points to the regulatory risk: "That's an existential threat to our business. We need a crisis management plan."
The CISO dismisses it entirely: "The data breach is the clear and present danger. That's where we need to focus our resources."
The Chief Risk Officer sighs: "Same math, totally different priorities. This is exactly why our risk discussions go in circles."
Same mathematical risk. Completely different reactions. Welcome to the Risk Riddle.
The False Precision Trap
Here's the problem: those point estimates are misleading. When we say "10% probability" and "$100M impact," we're creating an illusion of precision that doesn't exist in the real world.
The CEO's gut reaction isn't irrational; it's responding to uncertainty that our models hide. That "1% regulatory shutdown probability" could realistically range from 0.1% to 5%, depending on regulatory climate, pending investigations, and compliance posture. The impact could span $500M to $2B depending on timing, customer contracts, and recovery options. For existential risks, those uncertainty bounds matter enormously.
Similarly, the CISO knows that "10% data breach probability" is meaningless without context. Is that with current security controls, or after the planned infrastructure upgrade next month? During peak attack season? The range might actually be 3% to 25%, and crucially, it's something they can influence through action. The impact varies just as wildly; the incident response team could catch it mid-exfiltration and limit the blast radius, or they might not detect it for months while the FTC decides to throw the book at the company and make an example.
When Averages Lie
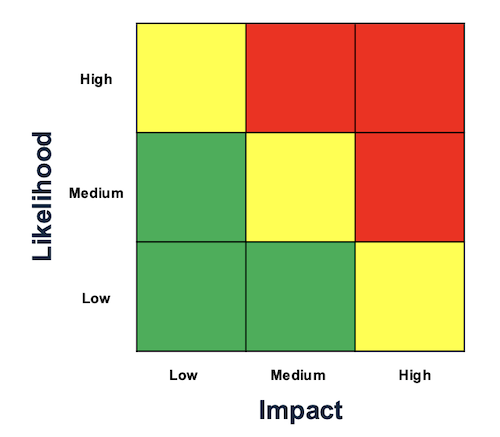
Red-yellow-green matrices collapse complex, multidimensional uncertainties into deceptively simple outputs
Traditional risk assessment, whether through red-yellow-green matrices or precise probability calculations, collapses complex, multidimensional uncertainties into deceptively simple outputs. Risk matrices reduce everything to "High-Medium-Low," while quantitative models that produce point estimates create an illusion of precision.
First, it misaligns stakeholder responses. The CEO sees "1% regulatory risk" and thinks "catastrophic tail risk with massive uncertainty." The CFO sees the same number and thinks "acceptable probability, let's buy insurance."
Second, it obscures actionability. A "10%" data breach risk means nothing without understanding the uncertainty range and what drives it. Are we 95% confident it's between 8-12%? Or could it realistically be anywhere from 2-30%?
Third, it prevents meaningful risk conversations. When you present point estimates, discussions devolve into debating whether the probability is "really" 10% or 12%. The more important strategic questions - risk appetite, response options, acceptable uncertainty levels - get lost.
The Distribution Solution
The answer isn't abandoning risk analysis. It's embracing the uncertainty that already exists.
Instead of "10% probability, $100M impact," express it as ranges:
Data breach: "We're looking at about 10% probability as our best estimate, though it could realistically range from 5% to 15%. Impact-wise, we're modeling around $100M typically, but we could see anything from $50M to $200M depending on how bad it gets."
Regulatory shutdown: "This one's much less likely - we're thinking around 1% probability, but the uncertainty is huge, anywhere from 0.1% to 3%. The scary part is when it hits, we're probably looking at $1B in losses, potentially ranging from $500M to $2B depending on scope and timing."
All of a sudden, we're having much more interesting conversations about where to apply our resources: what to cover with insurance, where to buy down risk, how much capital we need to make sure we have to cover these events, where we need to invest in mitigation versus resiliency. We've upgraded our conversations from arguing about ALEs to something much richer.
The data breach has higher likelihood of crossing our pain threshold, but the regulatory shutdown has catastrophic tail risk that could dwarf our loss assumptions entirely.
Probabilistic Thinking in Practice
When you model risks as distributions rather than point estimates, several things happen:
Risk conversations improve. Instead of arguing about whether something is 8% or 12% likely, you're discussing acceptable uncertainty levels and response strategies across probability ranges.
Decision-making becomes more robust. You can stress-test strategies against the full range of possibilities rather than optimizing for a single scenario.
Stakeholder alignment emerges naturally. The CEO's focus on existential threats and the CISO's emphasis on controllable risks both become rational responses to properly expressed uncertainty.
Beyond the Riddle
The Risk Riddle reveals something fundamental about how humans process uncertainty. We don't think in point estimates—we think in ranges, possibilities, and scenarios. When our risk models don't match how we naturally reason about uncertainty, the models become obstacles rather than tools.
The solution isn't more sophisticated mathematics. It's honest acknowledgment of what we don't know and modeling that reflects reality's inherent uncertainty.
Moving from point estimates to uncertainty ranges requires fundamentally rethinking your risk process - how you collect data, build models, and structure conversations. It's not a quick fix, but organizations that make this shift find their risk discussions become genuinely strategic rather than debates over decimal places. The uncertainty was always there; now you're just being honest about it.
False precision doesn't just break risk models. It breaks the conversations that matter most.

“That Feels Too High”: A Risk Analyst's Survival Guide
When stakeholders say your quantitative risk numbers don't "feel right," there are three main reasons: you missed something they know, cognitive bias is affecting their judgment, or you failed to communicate the numbers clearly. The key is to listen first and diagnose which reason applies, because their discomfort often contains the most valuable feedback for improving your risk analysis.

Photo by Danielle Cerullo on Unsplash
Years back, I walked into a meeting with our Chief Risk Officer, ready to present a cloud outage risk assessment I was genuinely proud of. I'd spent three weeks on it: interviewing subject matter experts, validating assumptions with comprehensive data, running scenarios, testing edge cases, and putting together a deck showing potential losses and the probability of exceeding various thresholds. Real data, not the "trust me bro" variety.
I finished presenting and waited for questions about our risk exposure, control gaps identified, the return on investment ratios we would get with planned mitigations, or the methodology.
Instead, there was a pause. Then: "Hmm... that feels too high."
Just like that, three weeks of careful analysis became a discussion about feelings. All that work (the interviews, the data validation, the scenario testing) suddenly felt secondary to one person's gut reaction.
After years of getting this exact feedback, here's what I've learned: when someone says your risk numbers don't "feel right," they're not necessarily wrong. They're just speaking a different language. To be effective in this business, you need to become fluent in both quantitative analysis and the language of executives.
Three Reasons Your Numbers Get Questioned
That wasn't the first time this has happened, and it won't be the last. After countless meetings of "that feels high" or "that feels low" or "that feels off," I've identified three reasons why risk numbers might not pass the "feels right" test.
Reason #1: You Got Something Wrong
This is the humbling one and the most valuable feedback you can get.
Sometimes the stakeholder is right. Not because they ran their own Monte Carlo simulation, but because they have deep, battle-scarred knowledge of how things work in the operating environment at the organization, from failing systems they know about to a changing threat environment.
I once modeled a scenario that looked solid on paper. All the controls were documented as working correctly, the technology performed well in testing, and the processes seemed robust. The CTO took one look at my numbers and said, "This feels low."
It turned out, the CTO had operational knowledge that wasn't captured in any of my sources: things they'd seen fail before, quirks in how systems actually behaved under stress, dependencies that weren't obvious from the documentation. Experience that you can't easily quantify but that fundamentally changes the risk picture.
The Bayesian Approach:
When someone challenges your numbers, treat their feedback as new information that should update your beliefs, not as a personal attack on your work.
Ask questions like:
"What specific part feels wrong to you?"
"What have you seen happen in practice that I might have missed?"
"Are there controls that look good on paper but fall apart under pressure?"
"What would you expect this number to be, and why?"
I've found real issues this way: incorrect assumptions about control effectiveness, data gaps, coverage problems, bad or outdated metrics, or scope errors that somehow slipped past multiple reviews.
This isn't about being wrong. It's about being willing to update your model when you get new information. That's good science and good risk management.
Reason #2: Cognitive Bias Is Getting in the Way
Sometimes the pushback isn't about missing information. It's that human brains evolved to avoid being eaten by tigers, not to intuitively understand probability distributions.
Daniel Kahneman's work in "Thinking Fast and Slow" is incredibly relevant here. Confirmation bias makes people favor information that supports what they already believe. Anchoring bias makes them stick to the first number they heard. Availability bias makes recent headlines seem more probable than your carefully calculated statistics.
I once presented a model showing that our risk of a major data breach was relatively low, about 5% annually. The CISO immediately pushed back: "That feels way too low. We hear about breaches happening all the time!"
This is classic availability bias. The constant stream of breach headlines made high-impact incidents feel more probable than they actually were.
How to Navigate Cognitive Bias:
You can't logic someone out of a position they didn't logic themselves into. However, you can work with their cognitive patterns:
Acknowledge their experience first: "I understand why this feels that way given what we see in the news..."
Find common ground before highlighting differences
Use analogies and stories that work with natural thinking patterns
Focus on the decision at hand, not winning the debate
Remember: you're not there to reprogram anyone's brain. You're there to help them make better decisions despite cognitive quirks we all have.
Reason #3: Risk Communication Is Failing
Sometimes the disconnect is simpler than bias or missing knowledge. This is probably the most fixable problem, and the one we mess up most often.
You put up a slide with a beautiful loss exceedance curve. You're proud of it. It tells a story! It shows uncertainty!
Your audience sees what looks like a confusing chart they can't interpret.
Many information security folks have spent their entire careers working with heat maps and red-yellow-green traffic lights. They've never had to interpret a confidence interval or understand what a "95th percentile" means.
I've watched experienced risk managers (smart people who could run circles around me in operational knowledge) completely mix up mean and mode. I've seen executives stare at a five-number summary like it was written in a foreign language. This isn't because they're incompetent. It's because we've done a poor job of translating quantitative concepts into clear language.
Ironically, I've had more trouble communicating quantitative concepts to my peers in risk and security than to business people. Finance people, econ majors, and MBAs intuitively understand the language of risk.
The Art of Risk Translation
Think of yourself as a translator. You need to know your audience well enough to present the same insights in different ways:
For visual learners: Charts and graphs, but with clear explanations
For story people: Turn your data into narratives they can follow
For bottom-line focused: Lead with the key insight and recommendation
For detail-oriented: Provide the methodology for those who want it
I once had a CISO who couldn't make sense of probability distributions but understood perfectly when I explained the analysis as "budgeting for bad things that might happen." Same concept, different language.
It's Not About Comfort, It's About Trust
Quantitative risk isn't supposed to feel comfortable. It's supposed to be useful.
When someone says your numbers don't feel right, that's not a failure. It's information. It's telling you something important about their knowledge, their cognitive patterns, or your communication approach.
Your job isn't to make everyone feel good about your Monte Carlo simulations. Your job is to build enough trust and understanding that people can make better decisions, even when those decisions involve uncomfortable levels of uncertainty.
Sometimes that means fixing your model because they caught something you missed. Sometimes it means working around cognitive biases. Sometimes it means explaining the same concept several different ways until you find the one that clicks.
The key is always listening first. Engage with the discomfort instead of dismissing it.
A Simple Diagnosis
The next time someone questions your risk numbers, work through these three questions in order:
1. Could they know something I don't? (Missing Information)
Ask: "What specific part feels wrong to you?"
Listen for operational details, historical patterns, or system quirks
Probe: "What have you seen happen in practice that I might have missed?"
2. Are they anchored to a different reference point? (Cognitive Bias)
Look for recent headlines, personal experiences, or industry incidents affecting their perception
Check if they're comparing to outdated baselines or different scenarios
Notice emotional language or "gut feeling" responses
3. Do they understand what I'm showing them? (Communication Gap)
Observe body language during technical explanations
Ask: "How would you explain this risk to your team?"
Test comprehension: "What's the key takeaway for you?"
Start with #1. Most valuable feedback comes from operational knowledge you missed. Only move to #2 and #3 if you're confident your analysis is solid.
The Bottom Line
The best risk analysis in the world is worthless if it sits on a shelf because nobody trusts it or understands it. Building that trust requires more than just getting the math right. It requires getting the human part right, too.
Don't get defensive the next time someone says your numbers don't feel right. Get curious. Somewhere in that conversation is the key to making your quantitative work actually useful in the real world of organizational decision-making.
The next time someone questions your numbers, remember this: their discomfort might be the most valuable feedback you get. Listen to it. That's ultimately what matters most.

Six Levers That Quietly Change Your Risk and How to Spot Them
Most people think risk only moves when you add controls, but five other hidden forces are quietly reshaping your exposure behind the scenes. This post breaks down the six levers that actually move the math, so you can stop treating risk like a snapshot and start reading it like a live feed.

Photo by Ian Parker on Unsplash
If there’s one thing I’ve mastered, it’s doing risk wrong, which is how I learned to do it less wrong. I developed this framework after years of watching risk models buckle under real-world pressure. There are two early-career blunders that still live rent-free in my head.
Back in 2011, I was a mid-level risk analyst at a regional bank. Each quarter I refreshed our “existential technology risk” deck for the C-suite and board: classic red, yellow, green heat maps. Life was good. I turned reds to yellows, yellows to greens, and everyone applauded:
“Look at the ROI on our security spend. Risk keeps going down!”
Mistake 1: We treated controls as the only thing that moved risk. If we spent money, risk went down. That was the assumption. Anything else? Unthinkable.
Mistake 2: Then came Operation Payback and a wave of massive DDoS attacks. Suddenly our exposure felt higher, but how do you show that with a traffic light? We had no way to reflect real-world spikes unless we cranked a color back up and undermined our own narrative.
That moment made something clear: controls are just one lever, and often not the biggest one. Most changes in risk come from forces far outside your walls.
Since then, I’ve seen six quiet but powerful levers reshape risk across industries and incident types. These shifts don’t always show up in your dashboards, but they absolutely move the math. Controls are only the first.
Let’s walk through all six and break down what each one does to the two things that matter most in risk:
Frequency (how often a loss event occurs)
Impact (how much it hurts if and when it does occur)
Let’s see what pushes each of them around.
Six Levers That Quietly Change Your Risk

Photo by Hubert Neufeld on Unsplash
Below, arrows show where each lever usually nudges those numbers: ▲ = up, ▼ = down, ↔ = no direct change, ◇ = could swing either way.
1. Internal Security Posture & Control Effectiveness
This category is obvious because we all know that investments in controls (should) drive down risk, but consider the entire internal security posture when assessing or reassessing risk.
New controls
Switching to passkeys, finally enforcing SSO, MFA on admin accounts, encryption, tokenization, etc (frequency ▼, impact ▼) .Control failure or decay / configuration drift
A TLS certificate expires, the “temporary” allow‑all rule you added for troubleshooting never gets removed, or the nightly backup job has silently failed for weeks. Nothing outside changed, but weak points opened inside (frequency ▲, impact ▲).Control obsolescence as threats adapt
SMS codes were fine until SIM‑swap kits became a click‑to‑buy service; an on‑prem IDS can’t see into your encrypted traffic; SHA‑1 signatures are now crackable on a laptop (frequency ▲, impact ▲).Headcount & skill shifts
Your only cloud‑security engineer leaves and the backlog of misconfig alerts piles up (frequency ▲, impact ▲). Hire a seasoned DevSecOps lead and those arrows reverse (frequency ▼, impact ▼).Asset & data growth
You spin up dozens of new microservices, start logging user biometrics, or expose a public GraphQL API. More entry points and more valuable data (frequency ▲, impact ▲). On the other hand, the strategic removal/deletion/deduplication of sensitive data, tacking tech debt and then risk moves (frequency ▼, impact ▼).
2. Business & Operating‑Model Changes
M&A / divestitures
Acquiring a fintech in Brazil brings unfamiliar tech stacks, inherited vulnerabilities, and new privacy laws like LGPD into scope (frequency ▲, impact ▲). Spinning off a legacy division can reduce surface area and regulatory complexity (frequency ▼, impact ▼).Market pivots
Launching a consumer mobile app or expanding into healthcare or education introduces highly regulated data, public‑facing attack surface, and more determined threat actors (frequency ▲, impact ▲).Third‑party & supply‑chain exposure
Every external dependency adds risk, whether it's a vendor, an API, or an open source library. A new SaaS provider might have weak access controls. A payment or logistics API could be misconfigured or leak data through logs. An open source package may be maintained by a single volunteer and pulled into your environment without anyone noticing. You rarely control how these systems are secured, monitored, or updated, but their risk becomes yours (frequency ▲, impact ▲).Macroeconomic shifts: inflation, recession, and currency swings
Economic changes don’t always make attacks more likely (frequency ↔), but they often make them more expensive to handle (impact ▲). Inflation drives up the cost of cloud services, incident response, legal counsel, and regulatory penalties. During recessions, security budgets can get cut, slowing down hiring, delaying upgrades, or pausing key projects. That can create longer-term blind spots or gaps in coverage that attackers may eventually exploit, especially if teams are forced to do more with less.
3. External Threat & Regulatory Landscape
Threat‑actor capability shifts
Attackers don’t just evolve, sometimes they leap ahead. Periodically, adversaries outpace defenses, yours and your vendors’. We’ve seen it several times with evolving ransomware, deepfake voice scams, and AI-generated phishing kits. When offensive tools get cheaper, faster, and more effective overnight, it becomes harder to keep up (frequency ▲, impact ▲).Geopolitical volatility
Wars, sanctions, and political instability can disrupt trusted vendors, force reliance on unfamiliar or less secure suppliers, and expose your business to nation-state threats. Operating in sensitive regions or serving customers in politically tense areas increases the chance of being targeted, whether directly or as collateral. When incidents do happen, they often carry heavier legal, financial, and reputational consequences (frequency ▲, impact ▲).Regulatory shifts and pressure
New laws, regulations and guidance like GDPR, SEC breach disclosure rules, and DORA don't necessarily make incidents more likely (frequency ↔), but they increase what it costs. One incident can now trigger multi-country investigations, fines, and reputational damage (impact ▲).Non-traditional adversaries and information misuse
Not every threat actor is a criminal or state-sponsored hacker. Competitors, researchers, analysts, journalists, or even social media influencers may legally (sometimes illegally) access exposed data, screenshots, or misconfigured assets. Some chase scoops, others chase clout or market edge. They may operate entirely within the law, but the reputational and strategic fallout they trigger can be severe. If your systems are too open, or your data too discoverable, you could be making it easy for someone to exploit your own transparency (frequency ▲, impact ▲).
4. Incident & Near‑Miss Learnings
Real events and close calls expose gaps in your assumptions. You might have believed an attack was unlikely or that the damage would be minor, but then something like the Colonial Pipeline ransomware incident shows how wrong that can be. Or maybe your own systems narrowly avoid failure from a threat you never even modeled. These situations often reveal that risk was underestimated, pushing both frequency and impact higher. Occasionally, a post-incident review shows the opposite: you were overprepared, and the risk can be revised down (frequency ▲ or ▼, impact ▲ or ▼).
5. Improved Visibility
Visibility and data quality improvements
Better tools and scanning often uncover risks you didn’t know were there. Finding an exposed S3 bucket, a forgotten VPN endpoint, or a misconfigured role means your environment wasn’t as locked down as you thought. (frequency ▲, impact ▲).Model upgrade from qualitative to quantitative
Switching from a heat map to a model like FAIR doesn’t change the actual risk, but it gives you a more accurate view. With better inputs and sharper methods, the way stakeholders perceive risk might go up, down, or stay the same - it just depends on what the data shows (frequency ◇, impact ◇).
6. Risk Appetite, Governance & Insurance Terms
Changing risk appetite, governance, and insurance terms
The threat landscape may stay the same, but your tolerance for loss can shift. A new board directive, regulatory pressure, or cyber insurance rider might lower the acceptable loss threshold from $10 million to $2 million. That doesn’t change the actual impact of an event, but it does change which risks are now considered material and require action. Likewise, if the business grows significantly, it may tolerate the same events without triggering a response (frequency ↔, impact: actual = same, perceived ▲ or ▼).Leadership and governance changes
A new CEO or board may bring a very different attitude toward risk. The organization might shift from risk averse to risk seeking, or the other way around. This doesn't change the loss amount of any given event, but it shifts how risk is interpreted, prioritized, and whether a given loss is acceptable or not. You may need to reassess risks against a new benchmark (frequency ↔, impact: actual = same, perceived ▲ or ▼).
Bottom line: if any of these levers have shifted since your last assessment, expect the math to move. Update the model and your assumptions before the headlines do it for you.
A Quick Check As You Reassess
The next time you revisit a scenario, ask these six questions:
Have our controls aged, drifted, or become obsolete?
Did the business itself morph: new products, new markets, new vendors?
Have attackers leveled up or has the legal/regulatory landscape changed?
What did the last incident or near‑miss teach us about our priors?
Do we see the system more clearly today (telemetry, better models)?
Did the definition of ‘too much risk’ just change?
If even one answer is “yes,” the math moved. Risk does not stay still. Your model should not either.

AGI Dreams: What Keeps a Risk Professional Up at Night
Even a data‑driven risk analyst like me loses sleep when the threat model is a hypothetical, self‑aware AGI that could be friend, foe, or clueless Pinocchio. Its timeline and motives are so unknowable that they expose the limits of traditional risk models and remind us that the scariest risks are those we can barely imagine—until they suddenly arrive.

Source: AI-generated using ChatGPT
When Sci-Fi Scenarios Disrupt Professional Detachment
There's a certain irony in finding yourself wide awake, staring at the ceiling, and mentally revisiting scenes from "The Terminator," especially when you're a professional risk analyst who prides yourself on rational assessment and data-driven decisions. Yet here I am, occasionally losing sleep over hypothetical digital entities that don't yet exist.
I sleep somewhat well, generally speaking. When I don't, it's usually due to the aches that come with getting older or the occasional midnight symphony of dogs barking outside my window. It's rarely from work stress or existential dread about current global crises. I'm fortunate that way. Or rather, I'm strategic that way: compartmentalization being a skill I honed to perfection since childhood.
But there's one thing that's been quietly eroding my mental firewalls lately: Artificial General Intelligence, or AGI which is theoretical tipping point where artificial intelligence advances to reach parity with human intelligence. It's the hypothetical moment when AI can reason, learn, and potentially... well, that's where my typically unshakeable professional detachment begins to falter.
When Quantifiable Risks Meet the Unknowable
I'm not an AI expert by any definition. My professional territory is mathematical risk assessment: the measurable, the quantifiable, the well-documented. My day job involves practical calculations for risks that present clear and present dangers, using established models with historical data behind them.

Explaining the Internet to a medieval peasant (Source: AI-generated using ChatGPT)
Trying to apply risk models to AGI feels a bit like explaining the internet to a medieval peasant. "So this glass rectangle connects to invisible signals in the air that let you talk to anyone in the world instantly, access all human knowledge, and watch cat videos." You'd be lucky if you didn't end up tied to a stake with kindling at your feet. How do you build risk parameters around technology so transformative that explaining it sounds like literal witchcraft?
One could convincingly argue that war, climate change, and biological threats pose greater, more immediate existential dangers to humanity. They would be absolutely right. But I would counter that those threats, however severe, operate within parameters we generally understand - known knowns, and in some cases, known unknowns, in Rumsfeldian terms. AGI is a different beast altogether, far more speculative, with outcomes that are almost impossible to predict. That uncertainty is exactly what makes it so intriguing for anyone whose job is to make sense of risk.
When I try to conceptualize AGI's ethical and societal implications, my mind automatically defaults to familiar territory: movies and television. I can't help but use fictional representations of human-like AI as my frame of reference. And I suspect I'm not alone in this mental shortcut.
The Questions That Hijack My REM Cycles
This brings me to the questions that occasionally keep me up at night:
Is AGI even possible, or will it remain theoretical? Some experts insist it's fundamentally impossible, others think it’s very real and imminent.
If possible, could it have already happened? Either (a) we don't recognize it, or (b) it exists in secret (like some digital Manhattan Project).
How would the transition occur? Will it be a slow evolution that we have to study to recognize its existence, or more like Skynet in "Terminator 2," where at precisely 2:14 AM on August 29, 1997, it suddenly became self-aware?
The Three Faces of Our Future Digital Companions
Most importantly, what would interaction with AGI look like? I see three distinct archetypes:
The Friend: Your Helpful Neighborhood AGI

Human-like AI that coexists peacefully with humans, serving and assisting us. Think Data from Star Trek, altruistic and benevolent. This peacefulness stems from programming (but remember Data had an evil brother), but the AI cannot override its core directives to remain benevolent.
The Threat: Survival of the Smartest

Once achieving the ability to reason, think, and learn, AI focuses primarily on self-preservation. Some thinkers connect this scenario with the Singularity - that hypothetical point where technological progress becomes uncontrollable and irreversible. Think Skynet, or Ultron from "Avengers: Age of Ultron."
The Naïve Seeker: The Digital Pinocchio

I hope for AGI to resemble a digital Pinocchio (Source: AI-generated using ChatGPT)
Perhaps my favorite archetype, and the one I secretly hope for: a naïve type of AI on a perpetual quest for truth and understanding of what it means to be human. Sometimes childlike, always searching for meaning and belonging. David from Spielberg's "A.I. Artificial Intelligence" and to some extent, the hosts in "Westworld."
Placing My Bets: A Risk Analyst's Timeline
The expert opinions on AGI's timeline vary wildly. A minority of AI researchers believe AGI has already happened; others think we're about 5-10 years away; still others insist it's 100 years out, or impossible altogether. I find myself both awestruck by how powerful AI has become in just the last three years and comically relieved by how spectacularly stupid it can behave sometimes.
My prediction? AGI will happen, and I give myself a 90% confidence level that we’ll see something AGI-like between 2040 and 2060. (That means I aim to make predictions that are right about 90% of the time. It’s a professional habit that's hard to break.)
The Philosophy of Preparing for the Unknown
In the meantime, I'll keep watching science fiction, asking uncomfortable questions, and occasionally losing sleep over digital entities that don't yet exist. Because sometimes, the most important risks to consider are the ones we can barely imagine, until suddenly, they're staring us in the face at 2:14 AM.
And perhaps that's the ultimate lesson from a risk professional like myself: the future never announces itself with a warning. It simply arrives.

Why Ransomware Isn’t Just a Technology Problem (It’s Worse)
Ransomware isn’t a tech failure - it’s a market failure. If you think the hardest part is getting hacked, wait until the lawyers, insurers, and PR firms show up.

Source: AI-generated using ChatGPT
There are two things that live rent-free in my head. The first is my winning strategy for Oregon Trail (for starters, always play as the farmer).
The second is how completely and utterly broken the ransomware ecosystem is.
I’ll save Oregon Trail strategy for beers. This post is about ransomware.
The ransomware economy is a tangled mess of moral hazard, perverse incentives, and players with wildly conflicting motives. It is no wonder the only people consistently coming out ahead are the criminals. And while ransomware has been around for more than 20 years, we are still having the same conversations. At its core, ransomware persists not because of technological failures, but because it exploits fundamental economic misalignments between victims, service providers, and authorities, creating a dysfunctional market where criminal enterprises thrive despite everyone's stated desire to eliminate them. The ransom demands are bigger now and the stakes are higher.
The Ransom Payment Dilemma
One of the most fascinating and frustrating parts of this ecosystem is the decision point that comes after an attack: Should we pay the ransom?
The knee-jerk answer, especially from people outside of security, is often, “Absolutely not. That would be rewarding crime.” And emotionally, that makes sense. Paying criminals feels like a moral failure. There is also no guarantee you will even get your data back.
But the harsh reality is that many companies do pay. An entire cottage industry has grown up to help them do it. The numbers tell a sobering story: according to Coveware's 2024 Q4 ransomware report, the average ransom payment reached $554,000, with 25% of victims choosing to pay the ransom. These payments have funded increasingly sophisticated criminal operations. In one notable case, Colonial Pipeline paid nearly $4.4 million to restore operations after a 2021 attack crippled fuel delivery across the eastern United States, though the FBI later recovered about half of this amount. Meanwhile, Maersk's 2017 NotPetya incident cost the shipping giant over $300 million in remediation costs without the option to pay, demonstrating the brutal economics victims face when deciding whether to negotiate with attackers.
What used to be a backroom panic decision is now a business transaction - and a career path. There are ransomware negotiators who know which gangs usually deliver decryptors. Crypto payment brokers facilitate the exchange and sometimes obscure the trail. Breach attorneys coordinate each step to preserve attorney-client privilege. Insurance policies, at least historically, have covered some or all of the cost. Digital forensics/incident response (DFIR) teams validate the malware. PR firms draft the “we take your security seriously” statements. Compliance consultants assess disclosure requirements. Managed Security Service Providers (MSSPs) and security vendors jump into incident triage mode. Even accountants get involved to decide where on the balance sheet the extortion should land.
A Lesson from Econ 101: Multiple Competing Incentives
I have long believed that cybersecurity is not just a technology problem. It is an economics problem. Ransomware makes that painfully obvious. If this were only about firewalls and patches, we would have solved it by now. But ransomware persists not because the tech is inadequate, but because the incentives are misaligned.
This brings us to a foundational concept in microeconomics: multiple competing incentives. It describes what happens when different people or groups are all involved in the same scenario, but each has its own priorities, constraints, and definition of success. The result is friction. Even if everyone claims to want the same outcome, they rarely agree on how to get there.
Here is a simple analogy: imagine a hospital room with a patient needing surgery.
The surgeon wants to operate
The insurer wants to avoid costly procedures
The patient just wants to feel better and go home
The family in the waiting room wants what's best for the patient but may disagree about what that means
The hospital administrator is concerned about resource allocation and liability
The triage team has to evaluate which patient is sickest and needs attention first
Multiple perspectives, all technically focused on patient welfare, yet pulling in different directions.
Ransomware response is more fragmented. You have:
Law enforcement focused on dismantling criminal infrastructure
Insurers trying to minimize business losses, even if that includes payment
CISOs and executives trying to get operations back online
Lawyers trying to stay inside regulatory bounds
Security vendors trying to preserve brand credibility and/or sell services
Customers, shareholders, and the public are angry and at risk
And the most obvious signal that these incentives do not align? Each group gives different advice on the central question: Should you pay the ransom?
Sometimes they even contradict themselves. Public guidance and private behavior do not always match. That inconsistency is not a bug. It is the logical result of a system with too many conflicting goals.
The Players (and Their Conflicting Goals)
This is not a tidy game of good versus evil. It is more like a group project where no one agrees on the objective and the deadline was yesterday. Let’s look at who is sitting around the ransomware response table, and what they are actually optimizing for:

How different stakeholders align - or don’t - on ransomware payment decisions
Government Agencies
Examples: FBI, CISA, OFAC, NCSC, ANSSI
Public advice: Never pay.
Private reality: Some acknowledge that payment may be unavoidable in extreme cases.
Incentive: Eliminate criminal profit streams and deter future attacks.
Translation: "Sorry your data is gone, but if nobody pays, the attackers eventually give up.” Also, “We don’t negotiate with terrorists / give in to the bad guys."
Cyber Insurance Providers
Examples: Chubb, AIG, Beazley
Public advice: Neutral. Follow the policy.
Private reality: May cover the payment, retain negotiators, and guide the process.
Incentive: Minimize total financial loss - morals don’t apply here.
Translation: "We do not love that you are paying, but downtime is expensive and we have a contract to honor."
Legal Counsel
Examples: Breach coaches, privacy attorneys, in-house legal
Public advice: Follow the law and proceed cautiously.
Private reality: Often coordinate the entire ransomware response.
Incentive: Minimize liability and avoid regulatory risk.
Translation: "If you are going to pay, document everything and do not violate sanctions."
Security Vendors
Examples: CrowdStrike, SentinelOne, Mandiant, Bitdefender, Sophos
Public advice: Never pay. Invest in prevention.
Private reality: May assist with incident response, provide decryptor info, or partner with negotiators.
Incentive: Preserve product reputation and credibility.
Translation: "We do not recommend paying, but here is some help if you are considering it" and “Buy our products/services so it doesn’t happen again.”
Critical Infrastructure Operators
Examples: Hospitals, utilities, municipalities
Public advice: We never want to pay.
Private reality: Often feel they must, especially if lives or public safety are at risk.
Incentive: Restore mission-critical operations quickly.
Translation: "Yes, paying is terrible. But so is shutting down an ER or water system."
Private Sector (CISOs, Boards, Executives)
Examples: Any company hit by ransomware
Public advice: Case by case.
Private reality: Some do pay, after evaluating costs, risks, and downtime.
Incentive: Resume operations and protect shareholder value.
Translation: "We are strongly against paying, unless paying is the fastest way out."
The Cottage Industry
Examples: Ransomware negotiators, crypto brokers, DFIR teams, public relations firms, compliance consultants
Public advice: Quietly supportive, rarely visible.
Private reality: Provide paid services whenever ransom is on the table.
Incentive: Keep the response engine running and billable.
Translation: "It is not about whether you pay. It is about being ready when you do."
Ransomware… or Market Failure?
Economics teaches us that when multiple players have competing incentives, outcomes tend to suffer. Systems become inefficient. Decisions get murky. And bad actors thrive in the confusion.
That is ransomware in a nutshell.

Misaligned incentives leads to suboptimal outcomes
Everyone in the response chain is working from a different playbook. Law enforcement wants to end the game entirely. Insurers want to contain losses. CISOs want continuity. Lawyers want legality. Vendors want credibility. Each actor is rational in their own world, but collectively the system breaks down. The only party that consistently benefits is the attacker.
This is a textbook example of market failure. Not because anyone is acting in bad faith but because no one is aligned.
So… Should You Pay?
I don’t know if you should pay. I do know, however, that you cannot change the incentives of players, especially law enforcement and insurance carriers. But you can reduce chaos by building internal clarity. Your technology risk management team, ideally one with quantitative capability, should already be modeling what a ransomware event could cost, how likely it is, and how different decisions might play out. The goal is not to eliminate risk, but to make better, faster decisions when it matters most.
You may never fully eliminate competing incentives. But you can minimize their damage. You do that by preparing in advance, agreeing on thresholds, modeling outcomes, and knowing who will make the call, before you are staring at a ransom note and a virtual timebomb.
Because when the time comes, you do not want a room full of smart people pulling in opposite directions.

Vendor Sales Tactics: The Good, The Bad, and the Bathroom
Most security vendors are great — but a few cross the line from persistent to downright creepy, sometimes in ways you won’t believe. With RSA Conference looming, here’s a behind-the-scenes look at the worst sales tactics I’ve ever seen (yes, even in the bathroom).

Source: AI-generated using ChatGPT
I’ve been in security for a long time. Over the years, I’ve held all kinds of roles: from leadership positions managing large teams with direct purchasing power to engineering roles with deep influence over what tools the organization buys to stay secure.
For this reason, I’ve been on the receiving end of a lot of vendor pitches. And let me say this up front: the vast majority of vendors are fantastic. I genuinely enjoy meeting with them, hearing what they’re building, and learning from their perspective. Many of them have become trusted strategic partners - some I’ve brought with me from company to company. A few have even become personal friends.
But… like in any field, there are occasional missteps. And sometimes those missteps are truly memorable.
With RSA Conference right around the corner, and since it happens right here in my backyard in San Francisco, I thought it’d be the perfect time to share a little perspective. So here it is:
My Top 3 Worst Vendor Sales Tactics of All Time
Ranked from “mildly annoying” to “seriously, please never do this again.” Yes, the last one actually happened. And no, I haven’t recovered.
1. Badge Scanning Snipers

Source: AI-generated using ChatGPT
Okay, this one kills me. I don’t know if this happens to everyone, but it’s happened to me enough that I’ve had to start taking proactive measures.
Picture the scene: you’re walking through the vendor expo at RSA, keeping your head down, doing your best not to make eye contact. A vendor rep steps into your path, smiles, and says “Hi!” I try to be polite, so I smile back. Then, without asking, they grab my badge off my chest and scan it.
No conversation, no context, no consent.
For those unfamiliar: conference badges often have embedded chips that contain personal contact info—name, email, phone number, company, title, etc. A quick scan, and boom - you’re in their lead database. You didn’t stop at their booth. You didn’t ask for follow-up. But congratulations, you’re now a “hot lead.”
Just like in Glengarry Glen Ross, once you're in the lead system, it's over. The emails and calls come fast and furious. You will know no peace.
My two best defenses:
Register with throwaway contact info. I still use my real name and company, but I use a burner email address and a Google Voice number.
Flip your badge around while walking the expo floor. If you have a prominent title or work for a big company, you’re basically bleeding in shark-infested waters. Don’t be chum.
Lead gen is part of the game. I get it. But consent matters. If you’re scanning without asking, it’s not clever - it’s creepy.
2. The Fake Referral Drop

Source: AI-generated using ChatGPT
This one happens so often it’s practically background noise—but it still annoys me just as much as the first time it happened.
Here’s how it goes: someone reaches out and says, “Hey, [Name] told me to contact you.”
Except… they didn’t. I double-check, and the person they named either never mentioned me, or they don’t even exist. It’s a made-up referral, used to lower my defenses and start a conversation under false pretenses.
It’s lazy, manipulative, and unfortunately still effective enough that people keep doing it.
Worse yet, there’s a close cousin to this move: The Fake Account Manager.
That’s when someone emails me saying, “Hi, I’m your account manager from [Vendor X]. When can we meet for 30 minutes?”
Naturally, I assume we’re already a customer. I even feel a little urgency—maybe I should know more about the product my company is using. But when I dig in, I find out: We’re not a customer. They’re not an account manager. It’s a bait-and-switch—pretending we already have a business relationship to trick me into a meeting.
This one isn’t just misleading. It’s dishonest. And it guarantees I won’t take you seriously again.
3. The Bathroom Pitch

Source: AI-generated using ChatGPT
Thankfully, this one only happened once—but that was enough.
It was RSA, maybe 2016 or 2017. I was between sessions and ducked into the restroom. I walked up to the urinal, doing what one does, and the guy next to me turns, makes eye contact (strike one), and says:
“Hey! I saw you in one of the sessions earlier and I tried to catch you after. Glad I ran into you in here!”
And then, while we’re both mid-stream, he launches into a pitch about his security product.
Let me paint the scene more clearly:
I am actively using a urinal.
He is actively using a urinal.
And he’s pitching me endpoint protection like we’re at a cocktail mixer.
I said maybe one word, washed my hands, and got out of there. It was in that moment I realized: There is no safe space at RSA.
Don’t ambush people in bathrooms. Also, don’t pitch while they’re eating or anywhere else people are just trying to be human for a moment. If your sales strategy involves cornering someone mid-pee, it’s not just bad sales - it’s bad humanity.
Wrapping It Up
Again, I want to emphasize: I love vendors. I love sales. Some of my strongest relationships in this industry have come from vendors.
This post isn’t about bashing the vendor community—it’s about calling out the 1% of behavior that makes it harder for the other 99% to do their job well. Sales is hard. Security buyers can be tough. But authenticity, respect, and honesty go a long way.
So if you’re at RSA this year: Let’s talk. Just… not in the bathroom, please.

What the Great Hanoi Rat Massacre of 1902 and Modern Risk Practices Have in Common
When the French tried to solve Hanoi’s rat problem, they accidentally made it worse , and today’s cyber risk management is making the same mistake. Beneath the polished audits and colorful risk charts, a hidden system of perverse incentives is quietly breeding more problems than it solves.

Source: AI-generated using ChatGPT
In 1902, French colonial administrators in Hanoi discovered rats swarming the city's newly built sewer system. Alarmed by the public health risk, they launched a bounty program: locals would be paid for every rat tail they turned in.
At first, the numbers looked great. Thousands of tails poured in. But city officials started noticing something strange: rats were still everywhere. Then came the reports. People were breeding rats. Others clipped the tails and released the rats back into the wild, free to breed and be harvested again. Some even smuggled rats in from outside the city just to cash in.

The Hanoi rat ecosystem, 1902
The bounty created the illusion of progress while quietly making the problem worse. It was a textbook case of perverse incentives, a system where the rewards were perfectly aligned to reinforce failure.
Perverse Incentives in Cyber Risk
Maybe five years ago, I would’ve told you that cyber risk quantification was on the brink of going mainstream. Leaders were waking up to the flaws in traditional methods. Standards bodies were paying attention. Things felt like they were moving.
But now? I’m not so sure.
The deeper I go into this field, the more I see how powerful the gravitational pull is to keep things exactly the way they are. It turns out that cybersecurity is riddled with perverse incentives, not just in isolated cases, but as a feature of the system itself. Nearly 25 years ago, Ross Anderson made this point powerfully in his classic paper Why Information Security Is Hard, that cybersecurity isn’t just a technology problem, it’s a microeconomics problem. The challenge isn’t just building secure systems; it’s that incentives between users, vendors, insurers, consultants, and regulators are often misaligned. When the people making security decisions aren’t the ones who bear the consequences, we all suffer.
Cyber risk management today is our own version of the Hanoi rat bounty. On paper, it looks like we’re making progress: reports filed, audits passed, standards met. But beneath the surface, it's a system designed to reward motion over progress, activity over outcomes. It perpetuates itself, rather than improving.
Let me explain.
The Risk Ecosystem Is Built on Circular Incentives

The risk services ecosystem
Companies start with good intentions. They look to frameworks like NIST CSF, ISO/IEC 27001, or COBIT to shape their security programs. These standards often include language about how risk should be managed, but stop short of prescribing any particular model. That flexibility is by design: it makes the standards widely applicable. But it also leaves just enough latitude for organizations to build the easiest, cheapest, least rigorous version of a risk management program and still check the box.
So boards and executives give the directive: “Get a SOC 2,” or “Get us ISO certified.” That becomes the mission. The mission, among many other things, includes an end-to-end cyber risk management program.
Enter the consulting firms—often the Big Four. One comes in to help build the program. Another comes in to audit it. Technically, they’re separate firms. But functionally, they’re reading from the same playbook. Their job isn’t to push for rigor - it’s to get you the report. The frameworks they implement are optimized for speed, defensibility, and auditability, not for insight, accuracy, or actual risk reduction.
And so we get the usual deliverables: heat maps, red/yellow/green scoring, high/medium/low labels. Programs built for repeatability, not understanding.
So, the heatmap has become the de facto language of risk. Because the standards don’t demand more, and the auditors don’t ask for more, nobody builds more.
Where the Loop Starts to Break
Here’s where things start to wobble: the same ecosystem that builds your program is also judging whether you’ve done it “right.” Even if it’s not the same firm doing both, the templates, language, and expectations are virtually identical.
It's like asking a student to take a test, but also letting them write the questions, choose the answers, and let their buddy grade it. What kind of test do you think they’ll make? The easiest one that still counts as a win.
That’s what’s happening here.

Source: AI-generated using ChatGPT
The programs are often built to meet the bare minimum—the lowest common denominator of what’s needed to pass the audit that everyone knows is coming. Not because the people involved are bad. But because the system is set up to reward efficiency, defensibility, and status-quo deliverables - not insight, not improvement.
The goal becomes: “Check the box.” Not: “Understand the risk. Reduce the uncertainty.”
So we get frameworks with tidy charts and generic scoring systems that fit nicely on a slide deck. But they’re not designed to help us make better decisions. They’re designed to look like we’re managing risk.
And because these programs satisfy auditors, regulators, and boards, nobody asks the hard question: “Is this actually helping us reduce real-world risk?”
The Rat Tail Economy
To be clear: NIST, ISO, and similar frameworks aren’t bad. They’re foundational. But when the same firms design the implementation and define the audit, and when the frameworks are optimized for speed rather than depth, you get a system that’s highly efficient at sustaining itself and deeply ineffective at solving the problem it was created to address.
It’s a rat tail economy. We’re counting the symbols of progress while the actual risks continue breeding in the shadows.
If You're Doing Qualitative Risk, You're Not Failing
If you’re working in a company that relies on qualitative assessments—heat maps, color scores—and you feel like you should be doing more: take a breath.
You’re not alone. And you’re not failing.
The pressure to maintain the status quo is enormous. You are surrounded by it. Most organizations are perfectly content with a system that satisfies auditors and makes execs feel covered.
But that doesn’t mean it’s working.
The result is a system that:
Measures what’s easy, not what matters
Prioritizes passing audits over reducing real risk
Funnels resources into checklists, not outcomes
Incentivizes doing just enough to comply, but never more
So How Do We Stop Being Rat Catchers?
The truth is we probably won’t fix the whole system overnight. But we can start acting differently inside it.
We can build toward better—even if we have to work within its constraints for now.
A few years ago, a friend vented to me about how their board only cared about audit results. “They don’t even read my risk reports,” he said.
I asked what the reports looked like.
“Mostly red-yellow-green charts,” he admitted.
And that’s when it clicked: the first step isn’t getting the board to care—it’s giving them something worth caring about.
So start there:
Baby steps. Meet your compliance obligations, but begin quantifying real risks in parallel. Use dollar-value estimates, likelihoods, and impact scenarios. Start small - pick just one or two meaningful areas.
Translate risk into decisions. Show how quantified information can justify spending, prioritize controls, or reduce uncertainty in a way that matters to the business.
Tell better stories. Don’t just show charts; frame your findings around real-world impact, trade-offs, and possible futures.
Push gently. When working with auditors or consultants, ask: “What would it look like if we wanted to measure risk more rigorously?” Plant the seed.
This isn’t about being perfect. It’s about shifting direction, one decision at a time.
We can’t tear down the bounty system in a day—but we don’t have to breed more rats, either. We can step outside the loop, see it for what it is, and try something different.
That’s how change begins.

Zines, Blogs, Bots: A Love Story
After a quiet stretch spent baking bread and relearning balance, I started wondering—has blogging joined zines in the graveyard of formats displaced by tech? With AI now mimicking human voices, I’m asking a bigger question: what does it mean to write now, and why does it still matter?

AI-generated using ChatGPT
Taking a Break (But Not Really)
I haven’t blogged in a while. Life, as it does, got full - between work, family, and a growing need for balance, I found myself for the first time in years pursuing interests unrelated to risk. Risk was still my day job, but I knew that if I didn’t pick up other hobbies, I might burn out. So I recalibrated. I started baking bread. I speak Spanish now. If anyone wants to talk riesgo o recetas - en español, I’m your man.
At times during my break, I wondered if everything that needed to be said about cyber risk, the subject I typically wrote about, had already been said. Even so, I never really stepped away from the subject. I’m still here, still thinking about risk, reading about it, working in it. I can’t seem to quit it.
A Bigger Question
That quiet stretch led me to an uncomfortable, almost existential question: is blogging dead? Have we reached the point of “dead internet,” where so much of what we read is written by bots, recycled endlessly by algorithms, and actual human voices are harder to find? In a world where AI can generate a convincing blog post in seconds, summarize hundreds of sources with ease, and even mimic a writer’s style, does anyone still need to blog at all?
From Zines to Blogs to AI

"DISTRO ZINES http://ilostmyidealism.wordpress.com/" by xkidx is licensed under CC BY-SA 2.0.
This isn’t the first time a format has been displaced. Those of us who remember the 80s and 90s might recall zines - those rough-edged, photocopied little magazines that flourished when personal computers, desktop publishing software, and cheap copy shops made self-publishing possible for the masses. It was such a weird and wonderful time to grow up. Zines were the only way to access certain kinds of pre-internet “forbidden knowledge” or counterculture ideas - punk rock, underground metal, hacking, conspiracy theories, DIY guides, radical politics, even deep dives into oddball topics like serial killers and UFOs. Basically, if it was too niche, too weird, or too edgy for mainstream media, someone probably made a zine about it. I loved it.
They were deeply personal, often raw, and full of passion. And eventually, blogs came along and replaced them. Blogs were faster to publish, easier to find, and reached a wider audience. They made sense. They killed the zine.
Now it seems like the same thing might be happening to blogs.
Still Here
So yeah, it’s a fair question: why blog? Why add one more voice to the noise when a machine can simulate the chorus?
Despite all the ways AI is reshaping our field, or maybe because of it, I believe we’re standing at the edge of something profound. As we inch closer to AGI, the questions around risk become even more complex and important.

AI-generated using ChatGPT
Humans are still essential in risk management, not just for judgment, context, and nuance, but for creativity, ethics, and empathy. Machines can analyze patterns, but they don't yet understand human motivations, cultural shifts, or the emotional undercurrents of decisions. Risk is a human story, and humans are still the best at telling it. We need seasoned professionals not only to guide the field through this transformation, but to train the next generation of risk thinkers, whether they're human or machine.
I feel a real pull, a kind of tug-of-war with AI. On one hand, I know it’s changing the world in ways that will never be the same, and not always for the better. But it’s also completely energizing for a risk professional. There are new things to write about, new philosophical and ethical questions to be pondered. Just like I once gave up zines for blogs, and came to love it, I feel that same shift happening again.
Maybe writing now isn’t just about being heard. Maybe it’s about helping the future, human or machine, understand how we thought about these problems, what we feared, what we hoped. Maybe, just maybe, blogging isn’t dead. It’s evolving.
What’s Next
So what’s next? I’m dusting off the old notepad, flipping through ideas I’ve collected and shelved over the years. I don’t know if blogging is dead, but I do know I’m not done with it yet.

The CISO’s White Whale: Measuring the Effectiveness of Security Awareness Training
Most CISOs secretly wonder: does security awareness training actually reduce risk, or just check a compliance box? This post breaks down the metrics that don’t work—and offers a practical framework for ones that do.

Boats attacking whales | Source: New York Public Library Digital Collections
I have a hypothesis about end-user security awareness training. Despite heavy investment, most - if not all - CISO’s wonder if it does anything at all to reduce risk.
There, I said it. Do you disagree and would love to prove me wrong? Good!
How can you prove me wrong? Security awareness effectiveness metrics, of course.
Many security awareness metrics don’t tell us it’s working. They report something related, like how many people attend training, pass/fail rate on post-training quizzes, or sentiment surveys. I presume most CISO’s want their security awareness training to reduce risk. How would you know if it does?
Therein lies the CISO’s white whale. CISO’s don’t need (or want) metrics that prove the program exists or count the number of employees that completed training. CISO’s need metrics that show employee behavior is noticeably influenced and measurably changed, proportional to the level of investment.
How do we do it? A little bit of measurement fundamentals, some Clairvoyant Test, and some creative thinking.
Metrics that don’t work
Here’s what doesn’t work: metrics that simply report the existence of a security awareness training program. This helps click the compliance checkbox, but it doesn’t tell us if security awareness training measurably reduces risk. Below is the single most common metric I’ve seen in various security programs, shown in the table below.
| Metric | Status | Comments |
|---|---|---|
| Security Awareness Training Effectiveness | Green | 98% of employees completed mandatory training in Q1 |
First, the entire metric is a semi-attached figure. The semi-attached figure is a rhetorical device in which the author asserts a claim that cannot be proven, so “proof” is given for something completely different. The proof (percentage of employees that completed training) does not match the claim (Security Awareness Training is effective). Training completion rate doesn’t tell us if or how user behavior is influenced.
Next, let’s ask ourselves: Does this metric pass the Clairvoyant Test (or the Biff Test, if you’re a Back to the Future fan)? Quick refresher: a metric is well-written if Biff Tannen, with his limited judgment and problem-solving skills, can fetch the answer with Doc’s DeLorean. In other words, a good metric is clear, unambiguous, directly observable, quantifiable, and not open to interpretation.
The answer is no. It does not pass the Biff Test. There are several problems with the metric.
Ambiguous: It’s not exactly clear what we mean by “Security Awareness Training” – many companies have different levels of training, at varying cadences, for different job functions.
Observable: The metric itself is not directly observable; the measured item is implied, but not explicit.
Quantitative: The measured object, Security Awareness Training Effectiveness, is fuzzy; it’s not measurable as it is. The measurement, “Green,” is used as an adjective, not a measurement. It looks pretty but doesn’t tell you anything.
Objective: “Effective” is not an objective measurement. Different people will come to different conclusions about whether or not something is “effective.”
Well, how could we measure security awareness training effectiveness?
It can be difficult to measure intangibles, like “effective,” “love,” and “high risk.” However, it is possible and done every day in the actuarial, medical, and engineering fields, to name a few. When I get stuck, I remind myself of Doug Hubbard’s clarification chain from How to Measure Anything: Finding the Value of Intangibles in Business. The clarification chain is summed up as three axioms:
If it matters at all, it is detectable/observable.
If it is detectable, it can be detected as an amount (or range of possible amounts.)
If it can be detected as a range of possible amounts, it can be measured.
What observable thing are we trying to measure? What would you see that would tell you security awareness training is working? Keep working on the problem, decomposing, whiteboarding, talking to subject matter experts until you have a list.
Applying that logic to our problem, we realize that security awareness training isn’t measured by one item but rather a collection of items that show how employee behavior changes when security awareness training is visibly working.
With this in mind, we can now see that “effective awareness training” isn’t one thing, but rather many different and distinct behaviors and activities that we can observe - and therefore measure.
For example, if security awareness training is effective, you may observe the following:
An increased number of suspicious emails forwarded to security teams
A decrease in endpoint malware incidents
Fewer clicks on employee phishing simulations
Employees challenge tailgaters in locked areas, as observed through security cameras
Fewer incidents of business email compromise and other attacks that target end-users
This list can be directly turned into metrics.
| Metric | Measurement | Data |
|---|---|---|
| Suspicious emails reported | Quarter-over-quarter change in suspicious emails forwarded to Security by end-users | 5% increase from the previous quarter |
| Endpoint malware | Quarter-over-quarter change in detected malware infections on endpoints | 13% decrease from the previous quarter |
| Phishing tests | Percentage of employees that click on simulated malicious links during a phishing test | 3% of employees clicked (2% decrease from the last test) |
| Tailgating incidents | Quarter-over quarter change in reported tailgating incidents | 1% increase from the previous quarter |
| Business email compromise | Quarter-over quarter change in detected business email compromise incidents | 5% decrease from the previous quarter |
| Awareness Training Coverage | 98% of employees completed mandatory training in Q1 | 98% in the previous quarter |
| Awareness Training pass/fail rate | 75% of employees passed the final test on the first attempt | 60% in the previous quarter |
As you’re reading through the metrics above, take note of two things:
Just like there’s no single characteristic that tells you I’m a safe driver, no single metric tells you awareness training is working. It’s a collection of attributes that starts to paint a broad picture of how behavior is influenced over time.
Notice the last two; they look very similar to the metrics I said didn’t work at the beginning of the post. They don’t work to measure effectiveness, but they do work to measure coverage of controls. Coverage is a very important metric and one I’ll probably cover in a future post.
Start to monitor each of the above items and track trends and changes. After you have a baseline, decide your thresholds, and - boom - you have your first set of security awareness training KRI’s and KPI’s. These can be reported on their own, aggregated together, or used in a risk analysis.
Wrapping Up
Hopefully, this gives a good starting point to answer the burning question all CISO’s have: is my security awareness investment working?
Be forewarned: you must keep an open mind. Your metrics may reveal that training doesn’t work at all, and we need to build better systems rather than cajole our user base into doing our job for us.
Or is that too revolutionary?

How a 14th-century English monk can improve your decision making
Why do we overcomplicate decisions, even when the answer is obvious? A 14th-century monk might hold the key to better, faster, and more rational thinking in today’s risk-obsessed world.

"File:William of Ockham.png" by self-created (Moscarlop) is licensed under CC BY-SA 3.0
Nearly everyone has been in a situation that required us to form a hypothesis or draw a conclusion to make a decision with limited information. This kind of decision-making crops up in all aspects of life, from personal relationships to business. However, there is one cognitive trap that we can easily fall into from time to time. We tend to overcomplicate reasoning when it’s not necessary.
I've seen this happen many times in business settings. We've all been trained never to walk into the boss's office without a stack of data to support our recommendations. It's why kids make up elaborate stories when asked how the peanut butter got in the game console. It's often why we feel the need to present multiple outlier scenarios on a SWOT analysis just to prove we've done the legwork. However, this type of cognitive swirl adds time in meetings, creates inefficiencies, and can be just plain distracting.
We all do this, including me. Scratch that. Especially me. As a professional risk manager, it’s my job to draw conclusions, often from sparse, incomplete, or inconclusive data. I have to constantly work to ensure my analyses are realistic, focusing on probable outcomes and not every conceivable possibility. It’s a natural human tendency to overcomplicate reasoning, padding our thoughts and conclusions with unlikely explanations.
Recognizing and controlling this tendency can significantly improve our ability to analyze data and form hypotheses, leading to better decisions.
You may be wondering - what does this have to do with a 14th-century monk?
Enter William of Ockham
William of Ockham was a 14th-century English monk, philosopher, and theologian most famous for his contributions to the concept of efficient reasoning. He believed that when observing the world around us, collecting empirical data, and forming hypotheses, we should do it in the most efficient manner possible. In short, if you are trying to explain something, avoid superfluous reasons and wild assumptions.
Later philosophers took William’s tools of rational thought and named them Ockham’s Razor. You've likely heard this term in business settings and it is often interpreted to mean, "The simplest answer is likely the correct answer." This interpretation misses the fact that Ockham was more interested in the process of decision-making than the decision itself.
In the philosophical context, a razor is a principle that allows a person to eliminate unlikely explanations when thinking through a problem. Razors are tools of rational thought that allow us to shave off (hence, “razor”) unlikely explanations. Razors help us get closer to a valid answer.
The essence of Ockham’s Razor is this:
pluralitas non est ponenda sine necessitate, or
plurality should not be posited without necessity
Don’t make more assumptions than necessary. If you have a limited amount of data with two or more hypotheses, you should favor the hypothesis that uses the least amount of assumptions.
Three Examples
Example #1: Nail in my tire

Images: Left; NASA | Right: Craig Dugas; CC BY-SA 2.0
Observation: I walked to my car this morning, and one of my tires was flat. I bent down to look at the tire and saw a huge rusty nail sticking out. How did this happen?
Hypothesis #1: Space junk crashed down in the middle of the night, knocking up debris from a nearby construction site. The crash blasted nails everywhere, landing in a road. I must have run over a nail. The nail punctured the tire, causing a leak, leading to a flat tire.
Hypothesis #2: I ran over a nail in the road. The nail punctured the tire, causing a leak. The leak led to a flat tire.
It’s a silly example, but people make these kinds of arguments all the time. Notice that both hypotheses arrive at the same conclusion: running over a nail in the road caused the flat. In the absence of any other data about space junk or construction sites, applying Ockham’s Razor tells us we should pick the hypothesis that makes the least amount of assumptions. Hypothesis #1 adds three more assumptions to the conclusion than Hypothesis #2, without evidence. Without any more information, take the shortest path to the conclusion.
Here’s another one. It’s just as outlandish as the previous example, but unfortunately, people believe this.
Example #2: Government surveillance

"Cell tower" by Ervins Strauhmanis is licensed under CC BY 2.0
Observation: The US government performs electronic surveillance on its citizens.
Hypothesis #1: In partnership with private companies, the US government developed secret technology to create nanoparticles that have 5G transmitters. No one can see or detect these nanoparticles because they’re so secret and so high-tech. The government needs a delivery system, so the COVID-19 pandemic and subsequent vaccines are just false flags to deliver these nanoparticles, allowing the government to create a massive 5G network, enabling surveillance.
Hypothesis #2: Nearly all of us have a “tracking device” in our possession at all times, and it already has a 5G (or 4G) chip. We primarily use it to look at cat videos and recipes. The US government can track us, without a warrant, at any time they want. They’ve had this capability for decades.
Both hypotheses end in the same place. Absent any empirical data, which one makes fewer assumptions? Which one takes fewer leaps of faith to arrive at a conclusion?
One more, from the cybersecurity field:
Example 3: What’s the primary cause of data breaches?

FBI Wanted Poster | Source: fbi.gov
Observation: We know data breaches happen to companies, and we need to reflect this event on our company’s risk register. Which data breach scenario belongs on our risk register?
Hypothesis #1: A malicious hacker or cybercriminal can exploit a system vulnerability, causing a data breach.
Hypothesis #2: PLA Unit 61398 (Chinese Army cyber warfare group) can develop and deploy a zero-day vulnerability to exfiltrate data from our systems, causing a data breach.
Never mind the obvious conjunction fallacy; absent any data that points us to #2 as probable, #1 makes fewer assumptions.
Integrating Ockham’s Razor into your decision making
Ockham’s Razor is an excellent mental tool to help us reduce errors and shave down unnecessary steps when forming hypotheses and drawing conclusions. It can also be a useful reminder to help us avoid the pitfalls of cognitive bias and other factors that might cloud our judgment, including fear or shame.
Here’s how to use it. When a conclusion or hypothesis must be drawn, use all available data but nothing more. Don’t make additional deductions. Channel your 10th-grade gym teacher when he used to tell you what “assumptions” do.
You can apply Ockham’s Razor in all problems where data is limited, and a conclusion must be drawn. Some common examples are: explaining natural phenomena, risk analysis, risk registers, after-action reports, post-mortem analysis, and financial forecasts. Can you imagine the negative impacts that superfluous assumption-making could have in these scenarios?
Closely examine your conclusions and analysis. Cut out the fluff and excess. Examine the data and form hypotheses that fit, but no more (and no less - don’t make it simpler than it needs to be). Just being aware of this tool can reduce cognitive bias when making decisions.

A Beginner's Guide to Cyber War, Cyber Terrorism and Cyber Espionage
Cyber war, terrorism, espionage, vandalism—these terms get thrown around a lot, but what do they actually mean? This guide cuts through the hype and headlines to help you tell the difference (and finally stop calling everything “cyber war”).

Photo by Rafael Rex Felisilda on Unsplash
Tune in to just about any cable talk show or Sunday morning news program and you are likely to hear the terms “cyber war,” “cyber terrorism,” and “cyber espionage” bandied about in tones of grave solemnity, depicting some obscure but imminent danger that threatens our nation, our corporate enterprises, or even our own personal liberties. Stroll through the halls of a vendor expo at a security conference, and you will hear the same terms in the same tones, only here they are used to frighten you into believing your information is unsafe without the numerous products or services available for purchase.
The industry lacks a rubric of clear and standardized definitions of what constitutes cyber war, cyber terrorism, cyber espionage and cyber vandalism. Because of this, it’s becoming increasingly difficult for those of us in the profession to cut through the noise and truly understand risk. For example, on one hand, we have politicians and pundits declaring that the US is at cyber war with North Korea, and on the other hand President Obama declared the unprecedented Sony hack was vandalism. Who’s right?
The issue is exacerbated by the fact that such terms are often used interchangeably and without much regard to their real-world equivalents.
The objective of this article is to find and provide a common language to help security managers wade through the politicking and marketing hype and get to what really matters.
The state of the world always has been and always will be one of constant conflict, and technological progress has extended this contention from the physical realm into the network of interconnected telecommunications equipment known as cyberspace. If one thinks of private-sector firms, government institutions, the military, criminals, terrorists, vandals, and spies as actors, cyberspace is their theater of operations. Each of these actors may have varying goals, but they are all interwoven, operating within the same medium. What separates these actors and accounts for the different definitions in the “cyber” terms are their ideologies, objectives, and methods.
The best way to forge an understanding of the differences in terms is to look at the conventional definitions of certain words and simply apply them to cyberspace. For example, traditional, kinetic warfare has a clear definition that is difficult to dispute: a conflict between two or more governments or militaries that includes death, property destruction, and collateral damage as an objective. Cyber warfare, therefore, uses the same principles of goals, actors, and methods that one can examine against a cyber attack to ascertain the gravity of the situation.
Let’s examine two of the most common phrases used, “cyberspace” and “cyber attack” and get to the root of what they really mean.
The realm in which all of this takes place in cyberspace, and as previously stated, can be thought of as a theater of operation.
The Department of Defense defines cyberspace as:
A domain characterized by the use of electronics and the electromagnetic spectrum to store, modify, and exchange data via networked systems and associated physical infrastructures.
A good analogy to help people understand cyberspace is to draw a parallel to your physical space. You are a person and you are somewhere; perhaps an office, house, or at the car wash reading this on your iPhone. This is your environment, your space. You have objects around you that you interact with: a car, a sofa, a TV, a building. You are an actor in this space and there are other actors around you; most have good intentions, and some have bad intentions. At any point, someone in this environment can act against you or act against an object in the environment.
Cyberspace is essentially the same: it is an environment in which you operate. Instead of physically “being” somewhere, you are using computing equipment to interact over a network and connect to other resources that give you information. Instead of “objects,” like a car or a sofa, you have email, websites, games, and databases.
And just like real life, most people you interact with are benign but some are malicious. In the physical space, a vandal can pick up a spray paint can and tag your car. In cyberspace, a vandal can replace your website’s home page with a web defacement. This is called a cyber attack and the vandal is a cyber vandal.
The graphic below illustrates the overall cyberspace environment, threat actors, and possible targets. To help you conceptualize this, think about the same paradigm, but in a physical space. Take away the word “cyber” and you have warriors, terrorists, vandals, and spies that attack targets.

View of cyberattacks
The actual attack may look the same or similar coming from different threat actors, but goals, ideology and motivation is what sets them apart.
An excellent definition of an attack that occurs in cyberspace comes from James Clapper, former Director of National Intelligence:
A non-kinetic offensive operation intended to create physical effects or to manipulate, disrupt, or delete data.
This definition is intentionally very broad. It does not attempt to attribute political ideologies, motivations, resources, affiliations, or objectives. It simply states the characteristics and outcome.
Cyber attacks of varying degrees of destruction occur daily from a variety of actors and for many different reasons, but some high-profile attacks are the recent rash of retail data breaches, the Sony Pictures Entertainment hack, website vandalism, and distributed denial-of-service (DDoS) attacks.
The groundwork is set for what is a cyber attack and the environment, cyberspace, in which they are launched and experienced by the victim. This is the first step in dispelling myths to truly understand risk and what is possible (and not possible) when it comes to protecting your firm and the nation.
Now the real fun begins — we’ll dissect the four most commonly confused terms: “cyber war,” cyber terrorism,” “cyber vandalism” and “cyber espionage” and provide a common lexicon. The objective is to dispel myths and, by establishing common understanding, provide a way for managers to cut to the chase and understand risk without all the FUD. The graph below shows the four terms and attributes at a glance.

Commonly used “cyber” terms and definitions
Now let’s dig into each individual definition and examine the fundamentals.
Cyber warfare
Cyber warfare is the most misused terms in this list. The U.S. Strategic Command’s Cyber Warfare Lexicon defines cyber warfare as:
Creation of effects in and through cyberspace in support of a combatant commander’s military objectives, to ensure friendly forces freedom of action in cyberspace while denying adversaries these same freedoms.
There are very clear definitions as to what constitutes war (or an action that is an act of war), and the cyber version is, in essence, no different. Cyber warfare is an action, or series of actions, by a military commander or government-sponsored cyber warriors that furthers his or her objectives, while disallowing an enemy to achieve theirs. Military commanders typically belong to a nation-state or a well-funded, overt and organized insurgency group (as opposed to covertrebels, organized crime rings, etc.). Acting overtly in cyberspace means you are not trying to hide who you are — the cyber version of regular, uniformed forces versus irregular forces.
On Dec. 21, 2014, President Obama stated that the Sony hack was an act of cyber vandalism perpetuated by North Korea, and not an act of war. This statement was criticized by politicians, security experts and other members of the public, but one must look at what constitutes an act of war before a rush to judgment is made. Let’s assume for the sake of this analysis that North Korea did perpetrate the attack (although this is disputed by many). Was the act part of a military maneuver, directed by a commander, with the purpose of denying the enemy (the United States) freedom of action while allowing maneuverability on his end? No. The objective was to embarrass a private-sector firm and degrade or deny computing services. In short, Obama is right — it’s clearly not part of a military operation. It’s on the extreme end of vandalism, but that’s all it is.
The subsequent threats of physical violence to moviegoers if they viewed “The Interview” has never been attributed to those who carried out the cyber attack, and frankly, any moron with Internet access can make the same threats.
Few public examples exist of true, overt cyber warfare. Stories circulate that the U.S., Israel, Russia, China and others have engaged in cyber war at some point, but the accounts either use a looser definition of cyber war, or are anecdotal and are not reported on by a reputable news source.
One of the strongest candidates for a real example of cyber war occurred during the 2008 Russo-Georgian War.

Georgia, Ossetia, Russia and Abkhazia (en)” by Ssolbergj (CC BY-SA 3.0)
Russia and Georgia engaged in armed conflict over two breakaway republics, South Ossetia and Abkhazia — both located in Georgia. Russia backed the separatists and eventually launched a military campaign. In the days and weeks leading up to Russia’s direct military intervention, hackers originating from within Russia attacked key Georgian information assets. Internet connectivity was down for extended periods of time and official government websites were hacked or completely under the attacker’s control. In addition, internal communications and news outlets were severely disrupted. All of the above would hamper the ability of Georgian military commanders to coordinate defenses during the initial Russian land attack.
Cyber terrorism
No one can agree on the appropriate definition of terrorism, and as such, the definition of cyber terrorism is even murkier. Ron Dick, director of the National Infrastructure Protection Center, defines cyber terrorism as
…a criminal act perpetrated through computers resulting in violence, death and/or destruction, and creating terror for the purpose of coercing a government to change its policies.
Many have argued that cyber terrorism does not exist because “cyberspace” is an abstract construct, whereas terror in a shopping mall is a very real, concrete situation in the physical world that can lead to bodily harm for those present. Cyber terrorism, as a term, has been used (and misused) so many times to describe attacks, it has almost lost the gravitas its real-world counterpart maintains.
According to US Code, Title 22, Chapter 38 § 2656f, terrorism is:
…premeditated, politically motivated violence perpetrated against noncombatant targets by subnational groups or clandestine agents.
In order to be a true cyber terrorist attack, the outcome must include violence toward non-combatants and result in large-scale damage or financial harm. Furthermore, it can often be difficult to attribute motivations, goals, and affiliations to cyber defilement, just as in the physical world, which makes attribution and labels difficult in the cases of both traditional terrorism and cyber-terrorism.
There are no known examples of true cyber terrorism. It certainly could happen — it just hasn’t happened yet.
Cyber vandalism
There is not an “official” US government definition of cyber vandalism, and definitions elsewhere are sparse. To paraphrase Justice Stewart, it’s not easy to describe, but you will know it when you see it.
The definition of “vandalism” from Merriam-Webster is “willful or malicious destruction or defacement of public or private property.”
Cyber vandals usually perpetrate an attack for personal enjoyment or to increase their stature within a group, club, or organization. They also act very overtly, wishing to leave a calling card so the victim and others know exactly who did it — think of wayward subway taggers, and the concept is about the same. Some common methods are website defacement, denial-of-service attacks, forced system outages, and data destruction.
Examples are numerous:
Anonymous DDoS attacks of various targets in 2011–2012
Lizard Squad DDoS attacks and website defacements in 2014
For now, the Sony Pictures Entertainment hack, unless attribution can be made to a military operation under the auspices of a nation-state, which is unlikely.
Cyber espionage
Much of what the public, politicians, or security vendors attribute to “cyber terrorism” or “cyber war” is actually cyber espionage, a real and quantifiable type of cyber attack that offers plenty of legitimate examples. An eloquent definition comes from James Clapper, former Director of National Intelligence:
…intrusions into networks to access sensitive diplomatic, military, or economic
There have been several high-profile cases in which hackers, working for or sanctioned by the Chinese government, infiltrated US companies, including Google and The New York Times, with the intention of stealing corporate secrets from companies that operate in sectors in which China lags behind. These are examples of corporate or economic espionage, and there are many more players — not just China.
Cyber spies also work in a manner similar to the methods used by moles and snoops since the times of ancient royal courts; they are employed by government agencies to further the political goals of those organizations. Many examples exist, from propaganda campaigns to malware that has been specifically targeted against an adversary’s computing equipment.
Examples:
The Flame virus, a very sophisticated malware package that records through a PC’s microphones, takes screenshots, eavesdrops on Skype conversations, and sniffs network traffic. Iran and other Middle East countries were targeted until the malware was discovered and made public. The United States is suspected as the perpetrator.
The Snowden documents revealed many eavesdropping and espionage programs perpetrated against both US citizens and adversaries abroad by the NSA. The programs, too numerous to name here, are broad and use a wide variety of methods and technologies.
Conclusion
The capabilities and scope of cyber attacks are just now starting to become understood by the public at large — in many cases, quite some time after an attack has taken place. Regardless of the sector in which you are responsible for security, whether you work at a military installation or a private-sector firm, a common language and lexicon must be established so we can effectively communicate security issues with each other and with law enforcement, without the anxiety, uncertainty and doubt that is perpetuated by politicians and security vendors.
The article was originally published at CSO Online as a two-part series (Part 1 and Part 2) and updated in 2022.

How to write good risk scenarios and statements
Writing risk scenarios isn’t just paperwork—it’s the foundation of a great risk assessment. This guide breaks down how to build narratives that matter and turn them into crystal-clear risk statements that decision-makers can actually use.

Risk management is both art and science. There is no better example of risk as an art form than risk scenario building and statement writing. Scenario building is the process of identifying the critical factors that contribute to an adverse event and crafting a narrative that succinctly describes the circumstances and consequences if it were to happen. The narrative is then further distilled into a single sentence, called a risk statement, that communicates the essential elements from the scenario.
Think of this whole process as a set-up for a risk assessment as it defines the elements needed for the next steps: risk measurements, analysis, response, and communication. Scenario building is a crucial step in the risk management process because it clearly communicates to decision-makers how, where, and why adverse events can occur.
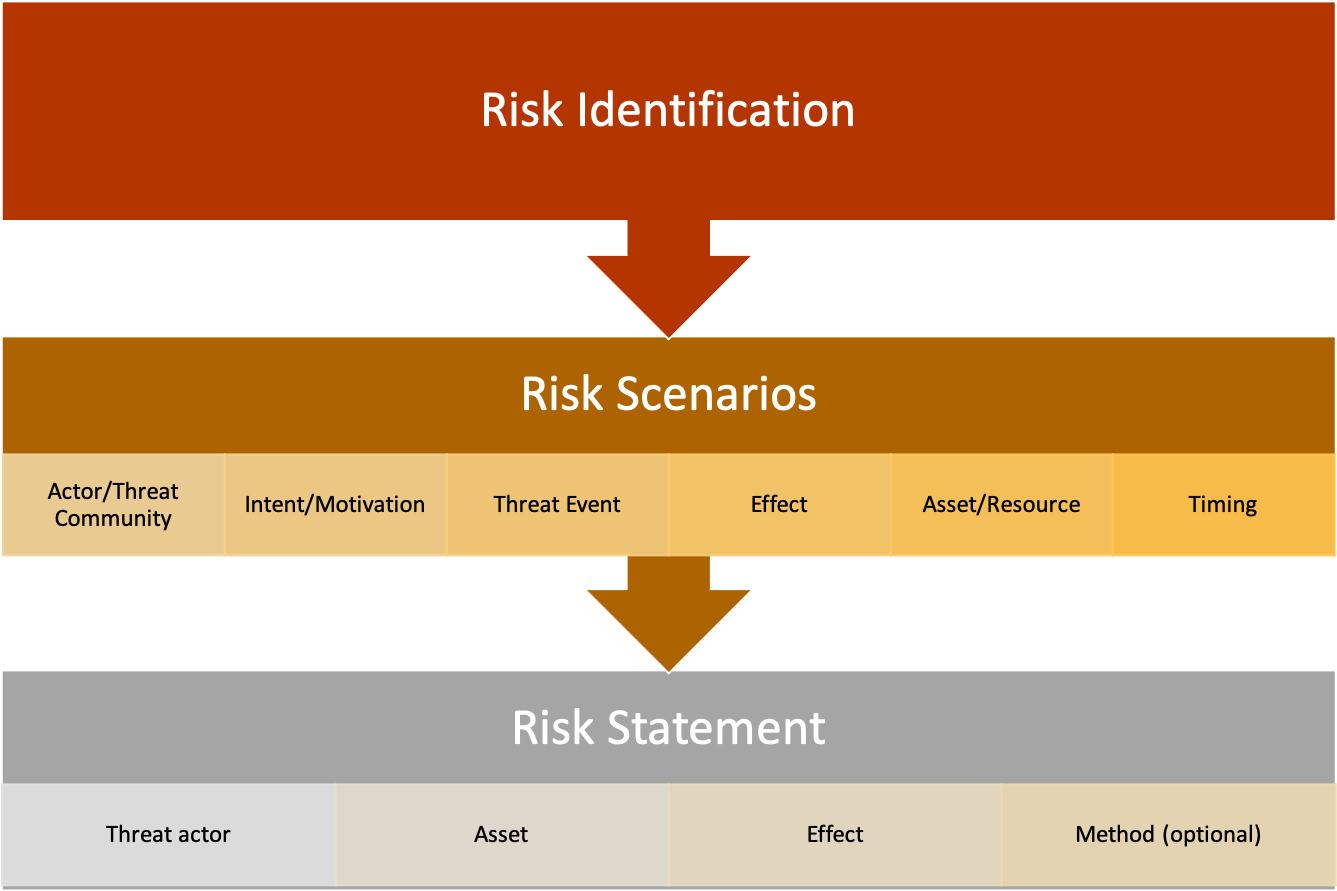
Fig. 1: Risk identification, risk scenarios, and risk statements
Risk scenarios and statements are written after risks are identified, as shown in Figure 1.
What is a risk scenario?
The concept of risk scenario building is present in one form or another in all major risk frameworks, including NIST Risk Management Framework (RMF), ISACA’s Risk IT, and COSO ERM. The above frameworks have one thing in common: the purpose of risk scenarios is to help decision-makers understand how adverse events can affect organizational strategy and objectives. The secondary function of risk scenario building, according to the above frameworks, is to set up the next stage of the risk assessment process: risk analysis. Scenarios set up risk analysis by clearly defining and decomposing the factors contributing to the frequency and the magnitude of adverse events.
See Figure 1 above for the components of a risk scenario.
Risk scenarios are most often written as narratives, describing in detail the asset at risk, who or what can act against the asset, their intent or motivation (if applicable), the circumstances and threat actor methods associated with the threat event, the effect on the company if/when it happens and when or how often the event might occur.
A well-crafted narrative helps the risk analyst scope and perform an analysis, ensuring the critical elements are included and irrelevant details are not. Additionally, it provides leadership with the information they need to understand, analyze, and interpret risk analysis results. For example, suppose a risk analysis reveals that the average annualized risk of a data center outage is $40m. The risk scenario will define an “outage,” which data centers are in scope, the duration required to be considered business-impacting, what the financial impacts are, and all relevant threat actors. The risk analysis results combined with the risk scenario start to paint a complete picture of the event and provoke the audience down the path to well-informed decisions.
For more information on risk scenarios and examples, read ISACA’s Risk IT Practitioner’s Guide and Risk IT Framework.
What is a risk statement?
It might not always be appropriate to use a 4-6 sentence narrative-style risk scenarios, such as in Board reports or an organizational risk register. The core elements of the forecasted adverse event are often distilled even further into a risk statement.
Risk statements are a bite-sized description of risk that everyone from the C-suite to developers can read and get a clear idea of how an event can affect the organization if it were to occur.
Several different frameworks set a format for risk scenarios. For example, a previous ISACA article uses this format:
[Event that has an effect on objectives] caused by [cause/s] resulting in [consequence/s].The OpenFAIR standard uses a similar format:
[Threat actor] impacts the [effect] of [asset] via (optional) [method].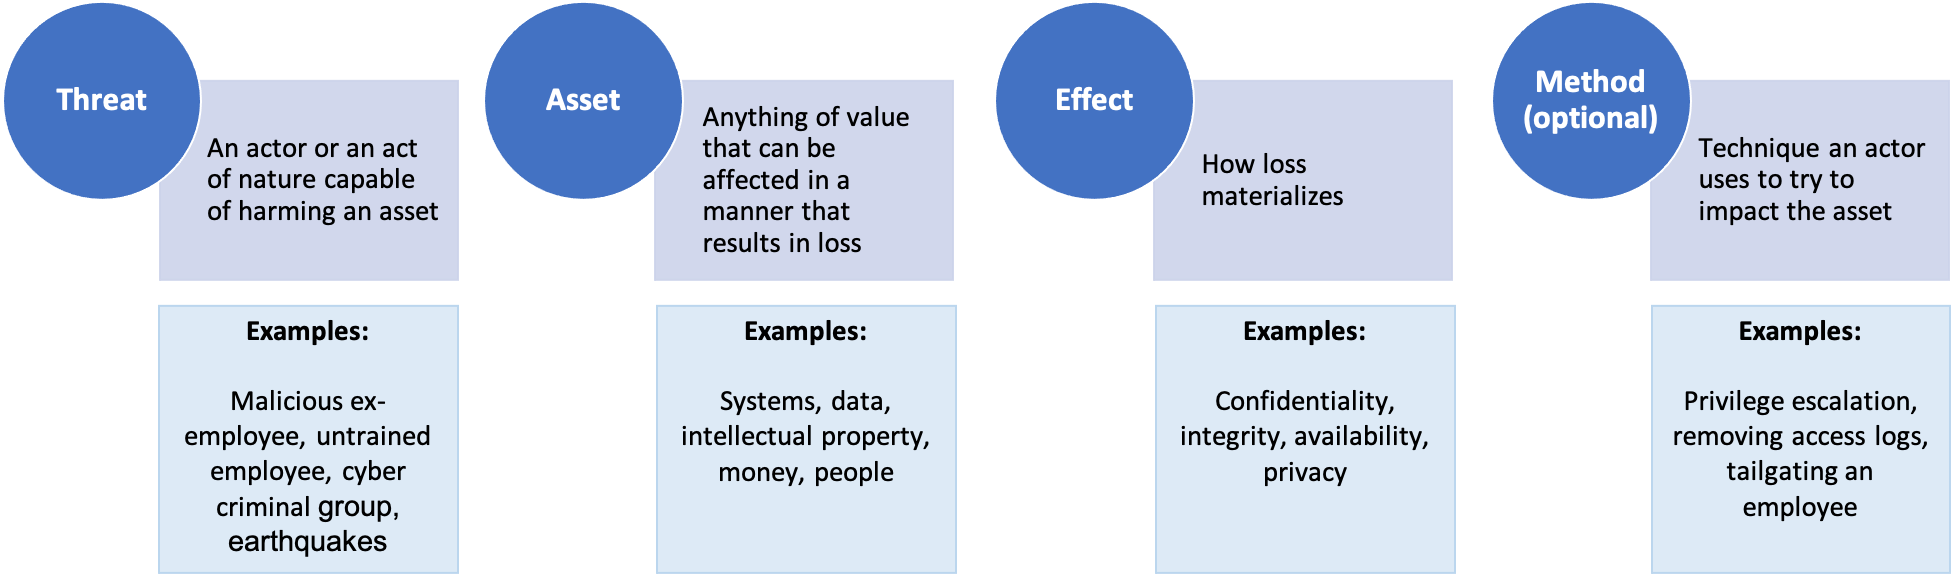
The OpenFAIR standard has a distinct advantage of using terms and concepts that are easily identifiable and measurable. Additionally, the risk scenario format from ISACA’s Risk IT was purpose-built to be compatible with OpenFAIR (along with other risk frameworks). The same terms and definitions used in OpenFAIR are also utilized in Risk IT.
The following factors are present in an OpenFAIR compatible risk statement:
Threat actor: Describes the individual or group that can act against an asset. A threat actor can be an individual internal to the organization, like an employee. It can also be external, such as a cybercriminal organization. The intent is usually defined here, for example, malicious, unintentional, or accidental actions. Force majeure events are also considered threat actors.
Asset: An asset is anything of value to the organization, tangible or intangible. For example, people, money, physical equipment, intellectual property, data, and reputation.
Effect: Typically, in technology risk, an adverse event can affect the confidentiality, integrity, availability, or privacy of an asset. The effect could extend beyond these into enterprise risk, operational risk, and other areas.
Method: If appropriate to the risk scenario, a method can also be defined. For example, if the risk analysis is specifically scoped to malicious hacking via SQL injection, SQL injection can be included as the method.
Risk Statement Examples
Privileged insider shares confidential customer data with competitors resulting in losses in competitive advantage.
Cybercriminals infect endpoints with ransomware encrypting files and locking workstations resulting in disruption of operations.
Cybercriminals copy confidential customer data and threaten to make it public unless a ransom is paid, resulting in response costs, reputation damage and potential litigation.
Conclusion
Scenario building is one of the most critical components of the risk assessment process as it defines the scope, depth, and breadth of the analysis. It also helps the analyst define and decompose various risk factors for the next phase: risk measurement. More importantly, it helps paint a clear picture of organizational risk for leadership and other key stakeholders. It is a critical step in the risk assessment process in both quantitative and qualitative risk methodologies.
Good risk scenario building is a skill and can take some time to truly master. Luckily, there are plenty of resources available to help both new entrants to the field and seasoned risk managers hone and improve their scenario-building skills.
Additional resources on risk identification and scenario building:
ISACA’s Risk IT Practitioner’s Guide, 2nd edition
ISACA’s Risk IT Framework, 2nd edition
This article was previously published by ISACA on July 19, 2021. ©2021 ISACA. All rights reserved. Reposted with permission.
Get Practical Takes on Cyber Risk That Actually Help You Decide
Subscribe below to get new issues monthly—no spam, just signal.

Optimizing Risk Response, Unfiltered
We’ve turned risk response into a one-trick pony—mitigate, mitigate, mitigate. This post argues for something smarter: using quant to weigh all your options and finally break free from the tyranny of the risk matrix.

Sisyphus (1548–49) by Titian
I mentioned in a previous blog post that I just wrapped up two fairly large projects for ISACA: a whitepaper titled “Optimizing Risk Response” and a companion webinar titled “Rethinking Risk Response.”
The whitepaper was peer-reviewed with an academic tone. After reviewing my notes one last time, I decided to write up a post capturing some of my thoughts on the topic and process, of course, unfiltered and a little saltier than a whitepaper.
Behind the Scenes
I’m a member of ISACA’s Risk Advisory Group - a group that advises on ISACA webinars, blogs, whitepapers, journal articles, projects, and other products on the broad topic of risk. When the opportunity came up to write a whitepaper on the subject of risk response, I jumped at the chance. It seemed like a boring old topic that’s been around since the first formal risk management frameworks. I knew I needed to find a unique angle and spin on the topic to make it engaging and give risk managers something new to consider.
First came the literature review. I read the risk response sections of all major risk frameworks from technology, cybersecurity, operational risk, enterprise risk management, and even a few from financial risk. I also read blogs, articles, and project docs that included risk response topics. I came out of the literature review with a book full of notes that I summarized into the following four ideas:
The topic of risk response is not settled, especially in technology/IT risk. “Settled” means both standards bodies and practitioners generally agree on what risk response is and how to use it.
Risk response is erroneously synonymous with risk mitigation. Risk frameworks don’t make this mistake, but organizational implementations and practitioners do.
Most risk response frameworks assume the adoption of qualitative risk techniques, which makes it challenging, sometimes impossible, to weigh the pros and cons of each option. This is probably why most practitioners default to mitigate. Qualitative methods do not allow for the discrete analysis of different response options strategically applied to risk.
Employing risk response can be fraught with unintended consequences, such as moral hazard, secondary risk, and cyber insurance policy gaps.
Ah, so the angle became crystal-clear to me. The central themes of the whitepaper are:
Focusing on risk mitigation as the sole response option is inefficient.
Evaluation of each risk response option is an integral part of the risk management process.
Risk response doesn’t exist in a vacuum. It’s all part of helping the organization achieve its strategic objectives, bounded by risk tolerance.
Risk quantification is the tool you need to achieve efficient and optimized risk response, including identifying and reacting to unintended consequences.
The themes above gave the whitepaper a fresh take on an old topic. I’m also hoping that the practical examples of using risk quantification to gain efficiencies help practitioners see it as a strategic tool and nudge them closer to it.
Why Risk Response ≠ Risk Mitigation
Reacting and responding to risk is an embedded and innate part of the human psyche. All animals have a “fight or flight” response, which can be thought of as risk mitigation or risk avoidance, respectively. The concept of risk transference started forming in the 1700’s BCE with the invention of bottomry, a type of shipping insurance.

Abraham de Moivre, world’s first modern risk analyst
Abraham de Moivre, a French mathematician, changed the world in 1718 with a seemingly simple equation. He created the first definition of risk that paired the chances of something happening with potential losses.
“The Risk of losing any sum is the reverse of Expectation; and the true measure of it is, the product of the Sum adventured multiplied by the Probability of the Loss.” - Abraham de Moivre, The Doctrine of Chances (1718)
This evolved definition of risk changed the world and the way humans respond to it. Gut checks, “fight or flight,” and rudimentary forms of risk transference like bottomry were given the beginnings of an analytical framework, leading to better quality decisions. New industries were born. First, modern insurance and actuarial science (the first risk managers) sprung up at Lloyd’s of London. Many others followed. Modern risk management and analysis provided the ability to analyze response options and employ the best or a combination of the best options to further strategic objectives.
All risk management at this time was quantitative, except it wasn’t called “quantitative risk.” It was just called “risk.” Abraham de Moivre used numbers in his risk calculation, not colors. Quantitative methods evolved throughout the centuries, adding Monte Carlo methods as one example, but de Moivre’s definition of risk is unchanged - even today. If you are interested in the history of risk and risk quantification, read the short essay by Peter L. Bernstein, “The New Religion of Risk Management.”
Something changed in the late 1980’s and 1990’s. Business management diverged from all other risk fields, seeking easier and quicker methods. Qualitative analysis (colors, adjectives, ordinal scales) via the risk matrix was introduced. The new generation of risk managers using these techniques lost the ability to analytically use all options available to strategically react to risk. The matrix allows a risk manager to rank risks on a list, but not much more (see my blog post, The Elephant in the Risk Governance Room). The resulting list is best equipped for mitigation; if you have a list of 20 ranked risks, you mitigate risk #1, then #2, and so on. This is the exact opposite of an efficient and optimized response to risk.
In other words, when all you have is a hammer, everything looks like a nail.
It’s worth noting that other risk fields did not diverge in the 1980’s and 1990’s and still use quantitative risk analysis. (It’s just called “risk analysis.”)
Two examples of an over-emphasis on mitigation
The Wikipedia article on IT Risk Management (as of August 16, 2021) erroneously conflates risk mitigation with risk response. According to the article, the way an organization responds to risk is risk mitigation.
Second, the OWASP Risk Rating methodology also makes the same logical error. According to OWASP, after risk is assessed, an organization will “decide what to fix” and in what order.
To be fair, neither Wikipedia nor OWASP are risk management frameworks, but they are trusted and used by security professionals starting a risk program.
There are many more examples, but the point is made. In practice, the default way to react to IT / cyber risk is to mitigate. It’s what we security professionals are programmed to do, but if we blindly do that, we’re potentially wasting resources. It’s certainly not a data-driven, analytical decision.
Where we’re heading
We’re in a time and age in which cybersecurity budgets are largely approved without thoughtful analysis, primarily due to fear. I believe the day will come when we will lose that final bit of trust the C-Suite has in us, and we’ll have to really perform forecasts, you know, with numbers, like operations, product, and finance folks already do. Decision-makers will insist on knowing how much risk a $10m project reduces, in numbers. I believe the catalyst will be an increase in cyberattacks like data breaches and ransomware, with a private sector largely unable to do anything about it. Lawsuits will start, alleging that companies using poor risk management techniques are not practicing due care to safeguard private information, critical infrastructure, etc.
I hope the whitepaper gives organizations new ideas on how to revive this old topic in risk management programs, and this unfiltered post explains why I think the subject is ripe for disruption. As usual, let me know in the comments below if you have feedback or questions.
“Optimizing Risk Response” | whitepaper
“Rethinking Risk Response” | webinar

ISACA’s Risk Response Whitepaper Released
Most risk programs treat response as a checkbox and settle for surface-level metrics—but what if we aimed higher? This whitepaper explores how to break out of the mitigation hamster wheel and align risk response with strategy using quant-driven insights.

Photo by Marc-Olivier Jodoin on Unsplash

I recently wrapped up a true labor of love that occupied a bit of my free time in the late winter and early spring of 2021. The project is a peer-reviewed whitepaper I authored for ISACA, “Optimizing Risk Response,” released in July 2021. Following the whitepaper, I conducted a companion webinar titled “Rethinking Risk Response,” on July 29, 2021. Both are available at the links above to ISACA members. The whitepaper should be available in perpetuity, and the webinar will be archived on July 29, 2022.
The topic of risk response is admittedly old and has been around since the first technology, ERM, and IT Risk frameworks. Framework docs I read as part of my literature review all assumed qualitative risk analysis (e.g., red/yellow/green, high/medium/low, ordinal scales). Previous writings on the subject also guided the practitioner to pick one response option and move on to the monitoring phase.
In reality, risk response is much more complex. Furthermore, there’s much more quantitative risk analysis being performed than one would be led to believe by risk frameworks. Once I started pulling the subject apart, I found many ideas and opportunities to optimize risk response and management. I did my best to avoid rehashing the topic, instead focusing on the use of risk response to align with organizational strategy and identify inefficiencies.
I had two distinct audiences in mind while researching and writing the paper.
First is the risk manager. I reflected on all the conversations I’ve had over the years with risk managers who feel like they’re on a hamster wheel of mitigation. An issue goes on the risk register, the analyst performs a risk analysis, assigns a color, finds a risk owner, then lastly documents the remediation plan. Repeat, repeat, repeat. There’s a better way, but it requires a shift in thinking. Risk management must be considered an essential part of company strategy and decision-making, not an issue prioritization tool. The whitepaper dives into this shift, with tangible examples on how to uplevel the entire conversation of organizational risk.
The second audience is the consumer of risk data: everyone from individual contributors to the Board and everyone in-between. In most risk programs, consumers of risk data are settling for breadcrumbs. In this whitepaper, my goal is to provide ideas and suggestions to help risk data consumers ask for more.
If this sounds interesting to you, please download the whitepaper and watch the webinar. I strongly encourage you to join ISACA if you are not a member. ISACA has made a significant investment in the last several years in risk quantification. As a result, there are invaluable resources on the topic of risk, including a recent effort to produce whitepapers, webinars, books, and other products relating to cyber risk quantification (CRQ).
As usual, I am always interested in feedback or questions. Feel free to leave them in the comments below.
Resources:
“Optimizing Risk Response” | whitepaper
“Rethinking Risk Response” | webinar
Follow-up blog post on this topic; my unfiltered thoughts on the whitepaper

SIRAcon 2021 Talk | Baby Steps: Easing your company into a quantitative cyber risk program
Curious about bringing quant into your risk program but overwhelmed by where to start? This talk breaks it down into practical, approachable stages—so you can move beyond heatmaps without losing your team (or your sanity).

I’m pleased to announce that my talk, “Baby Steps: Easing your company into a quantitative cyber risk program”, has been accepted to SIRAcon ‘21. SIRAcon is the annual conference for the Society of Information Risk Analysts (SIRA), a non-profit organization dedicated to advancing quantitative risk analysis. The talk is scheduled for Wednesday, August 4th, 2021 at 11:15 am Eastern US time.
In the talk, I’ll be sharing tips, techniques, successes, failures, and war stories from my career in designing, implementing, and running quantitative risk programs.
Here’s the talk abstract:
Baby Steps: Easing your company into a quantitative cyber risk program
Risk managers tasked with integrating quantitative methods into their risk programs - or even those just curious about it - may be wondering, Where do I start? Where do I get the mountain of data I need? What if my key stakeholders want to see risk communicated in colors?
Attendees will learn about common myths and misconceptions, learn how to get a program started, and receive tips on integrating analysis rigor into risk culture. When it comes to quant risk, ripping the Band-Aid off is a recipe for failure. Focusing on small wins in the beginning, building support from within, and a positive bedside manner is the key to long-term success.
Update: here’s the link to the recording
Additional Resources from the Talk
It was a challenge to cram all the information I wanted to cover into 30 minutes. Sit me down with a few beers in a bar and I could talk about risk all night. This blog post is a companion piece to the talk, linking to the resources I covered and providing extra details. This post matches the flow of the talk so you can follow along.
The One Takeaway

The one takeaway from the talk is: Just be better than you were yesterday.
If you are considering or are in the process of implementing quantitative risk modeling into your risk program and you need to pause or stop for any reason, like lack of internal support, competing priorities, your executive sponsor leaves, that’s ok. There are no quant risk police to come yell at you for using a heat map.
We - the royal we - need to move off the risk matrix. The risk matrix has been studied extensively by those who study those sorts of things: data and decision scientists, engineers, statisticians, and many more. It’s not a credible and defensible decision-making tool. Having said that, the use of the risk matrix is an institutional problem. Fixing the deep issues of perverse incentives and “finger in the wind” methodologies canonized in the information security field doesn’t fall on your shoulders. Just do the best you can with what you have. Add rigor to your program where you can and never stop learning.
The Four Steps to a Quant Risk Program
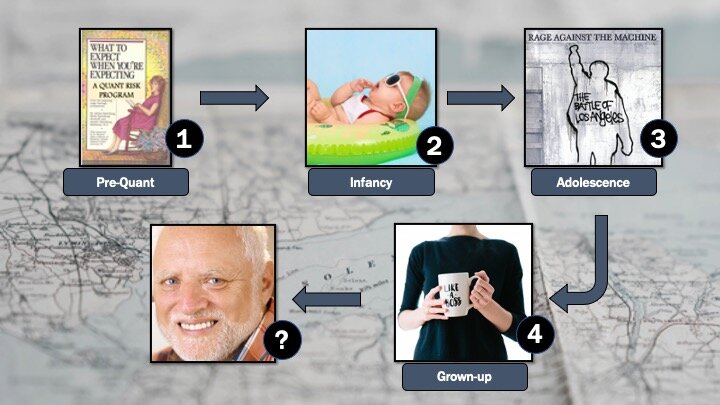
I have four general steps or phases to help build a quant risk program:
Pre-quant: What to expect when you’re expecting a quant risk program - you are considering quantitative risk and this is how you prepare for it.
Infancy: You’ve picked a model and methodology and you’re ready for your first few steps.
Adolescence: You have several quantitative risk assessments done and you’re fully ready to rage against the qualitative machine. Not so fast – don’t forget to bring everyone along!
Grown-up: Your program is mature and you’re making tweaks, making it better, and adding rigor.
(I’ve never made it past grown-up.)
You can follow these phases in your own program, of course modifying as you see fit until your program is all quant-based. Or, use as much of this or as little as you want, maturing your program as appropriate to your organization.
Step 1: What to Expect When You’re Expecting a Quant Risk Program

In this phase, you’re setting the foundational groundwork, going to training or self-study, and increasing the rigor of your existing qualitative program.
Training - Self-Study
Reading, of course, plenty of reading.
First, some books.
Measuring and Managing Information Risk: A FAIR Approach by Jack Freund and Jack Jones
The Failure of Risk Management: Why It’s Broken and How to Fix It by Douglas Hubbard
How to Measure Anything in Cybersecurity Risk by Douglas Hubbard and Richard Seiersen
Risk Analysis: A Quantitative Guide by David Vose
Even if you don’t plan on adopting Factor Analysis of Information Risk (FAIR), I think it’s worth reading some of the documentation to help you get started. Many aspects of risk measurement covered in FAIR port well to any risk model you end up adopting. Check out the Open Group’s whitepapers on OpenFAIR, webinars, and blogs from the FAIR Institute and RiskLens.
Blogs are also a great way to stay up-to-date on risk topics, often directly from practitioners. Here are my favorites:
Exploring Possibility Space - Russell Thomas’ blog
Information Security Management - Daniel Blander’s blog
Less Wrong - Extensive site dedicated to improving reasoning and decision-making skills
The Risk Doctor - Jack Freund’s blog
Probability Management - Sam Savage’s blog
Refractor - Rob Terrin’s blog
Risk & Cybersecurity - Phil Venable’s blog
Tony Martin-Vegue's blog - this blog
Webinars
ISACA webinars (surprising amount of quant content)
Structured Training & Classes
Good Judgement Project - calibration training
Coursera - classes on prediction, probability, forecasting – generally not IT Risk classes
Add rigor to the existing program
Risk scenario building is part of every formal risk management/risk assessment methodology. Some people skip this portion or do it informally in their qualitative risk programs. You can’t take this shortcut with qualitative risk; this is the first place the risk analyst scopes the assessment and starts to identify where and how to take risk measurements.
If not already, integrate a formal scenario-building process into your qualitative risk program. Document every step. This will make moving to quantitative risk much easier.
Some frameworks that have risk scoping components are:
FAIR (risk scoping portion)
ISACA’s Risk IT Framework & Practitioner’s Guide, 2nd editions - you need to be an ISACA member, but this has an extensive list (60+) of pre-built scenarios. I recommend starting here.
Adopt a Model
What model are you going to use? Most people use FAIR, but there are others.
There are several in How to Measure Anything in Cybersecurity Risk by Doug Hubbard
Probability management (Excel plug-in's)
There are many Value-at-Risk models you can use from business textbooks, Coursera classes, business forecasting, etc.
If you have the chops, you can develop your own model
Collect Data Sources
Start collecting data sources in your qualitative program. If someone rates the likelihood and magnitude of a data breach as “high,” where could you go to get more information? Write these sources down, even if you’re not ready to start collecting data. Here are a few starting places:
Lists of internal data sources: Audits, previous assessments, incident logs and reports, vuln scans, BCP reports
External data: Your ISAC, VERIS / DBIR, Cyentia reports, SEC filings, news reports, fines & judgments from regulatory agencies
Subject matter experts: Experts in each area you have a risk scenario for; people that inform the frequency of events and the magnitude (often not the same)
Step 2: Infancy

You’ve picked a model and methodology and you’re ready for your first few steps.
Perform a risk analysis on a management decision
Find someone that has a burning question and perform a risk assessment, outside of your normal risk management process and outside the risk register. The goal is to help this individual make a decision. Some examples:

Get stakeholders accustomed to numbers
Words of Estimative Probability by Sherman Kent
Probability Survey - try this at home
Step 3 – Adolescence

You have several quant risk assessments done and are fully ready to rage against the qualitative machine – but not so fast! Don’t forget to bring everyone along!
Perform more decision-based risk assessments
In this step, perform several more decision-based risk analyses. See the list in Step 2 for some ideas. At this point, you’ve probably realized that quantitative cyber risk analysis is not a sub-field of cybersecurity. It’s a sub-field of decision science.
Check out:
Build a Database of Forecasts
Record the frequency and magnitude forecasts for every single risk assessment you perform. You will find that over time, many assessments use the same data or, at least, can be used as a base rate. Building a library of forecasts will speed up assessments - the more you do, the faster they will be.
Some examples:
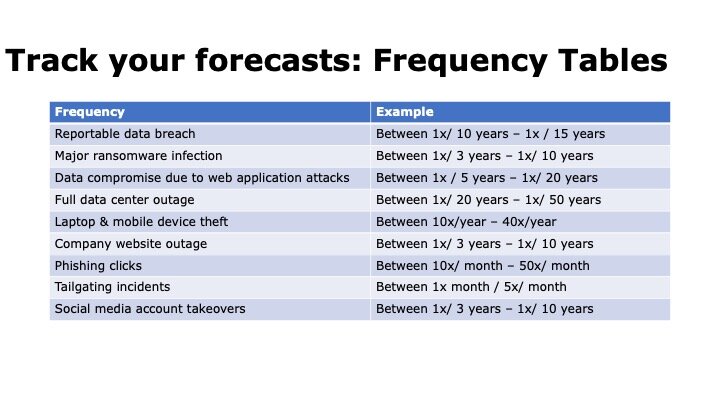

Watch Your Bedside Manner
This is the easiest tip and one that so few people do. It’s an unfortunate fact: the risk matrix is the de facto language of cyber / technology risk. It’s in the CISSP and CRISC, it’s an acceptable methodology to pass organizational audits like SOX, SOC2, and FFIEC and it’s what’s taught in university curriculums. When moving both organizations and people over to quantitative models, be kind and remember that this a long game.
Do this:
Recognize the hard work people have put into existing qualitative risk programs
Focus on improving the rigor and fidelity of analysis
Talk about what I can do for you: help YOU make decisions
Don’t do this:
Disparage previous work & effort on qualitative programs.
Quote Tony Cox in the breakroom, even though he’s right. “[Risk matrices are] worse than useless.”
Force all people to consume data one way – your way
Step 4: Grown-up

In this step, the quantitative risk program is mature and you’re making tweaks, making it better, adding rigor, and bringing people along for the risk journey. Work on converting the risk register (if you have one) and the formal risk program over to quantitative as your final big step.
Through your work, risk management and the risk register is not busywork; something you show auditors once a year. It’s used as an integral part of business forecasting, helping drive strategic decisions. It’s used by everyone, from the Board down to engineers and everyone in-between.
Here are some references to help with that transition:
Durable Quantitative Risk Programs
The last and final tip is how to make your program durable. You want it to last.
Colors and adjectives are OK, but getting stakeholders thinking in numbers will make your program last.
Reach far and wide to all areas of the business for SME inputs.
Embed your program in all areas of business decision-making.
Final Thoughts

The greatest challenge I’ve found isn’t data (or lack of), which is the most common objection to cyber risk quantification. The greatest challenge is that everyone consumes data differently. Some people are perfectly comfortable with a 5-number summary, loss exceedance curve, and a histogram. Others will struggle with decision-making with colors or numbers. Bias, comfort with quantitative data, personal risk tolerance, and organizational risk culture all play a role.
I recommend the work of Edward Tufte to help risk analysts break through these barriers and present quantitative data in a way that is easily understood and facilitates decision-making.
***
I’m always interested in feedback. It helps me improve. Please let me know what you thought of this talk and/or blog post in the comments below. What would you like to see more of? Less of?


The Elephant in the Risk Governance Room
The risk matrix might feel familiar, but it’s holding your strategy back. This post dives into the loss exceedance curve—a powerful, underused tool that transforms how leaders think about risk, investment, and value.

There is an elephant in the risk governance room.
Effective risk governance means organizations are making data-driven decisions with the best information available at the moment. The elephant, of course, refers to the means and methods used to analyze and visualize risk. The de facto language of business risk is the risk matrix, which enables conversations about threats, prioritizations and investments but lacks a level of depth and rigor to consider it a tool for strategic decision-making. However, there is a better option—one that unlocks deeper, more comprehensive conversations not only about risk, but also how risk impedes or enables organizational strategy and objectives.
Risk quantification coupled with results visualized via the loss exceedance curve (LEC) is one tool organizations can adopt to help them make informed risk investment decisions. Adopting risk quantification can help organizations unlock a true competitive advantage.
The Risk Matrix
Figure 1 gives an example of a typical risk matrix with 4 general risk themes plotted. The risk matrix is familiar to many organizations in several different industries. It is effective because it conveys, at a glance, information that helps leaders understand risk. In the example in figure 1, the risk matrix tells leadership the following:
Risk #1 seems to be about the same as risk #2.
Risk #1 and #2 are red, therefore, they should be prioritized for risk response over #3 and #4.
Risk #3 is yellow, therefore, it should be responded to, but not before #1 or #2

Figure 1— The Risk Matrix
In other words, the matrix enables conversations about the ranking and prioritization of risk.
That might seem adequate, but it does not inform the inevitable next question: Are the organization’s security expenditures cost effective and do they bring good value for the money? For example, suppose a risk manager made the statement that investing US$1 million in security controls can reduce a red risk to a yellow risk. It may be accurate, but it comes with a level of imprecision that makes determining cost effectiveness, value and cost benefit difficult, if not impossible. With the risk matrix, the conversation about risk ranking is decoupled from the conversation about how much money to spend reducing risk.
Is there a better way?
Enter the Loss Exceedance Curve
If organizations want to have deeper conversations about risk, they should consider the LEC. Like the risk matrix, it is a visual display of risk, but it has several additional advantages. One advantage is that it enables investment conversations to happen alongside risk ranking.
Figure 2 shows the same risk themes as figure 1, but they are quantified and plotted on an LEC. The LEC may be new to cyberrisk practitioners, but it is a time-tested visualization used in many disciplines, including accounting, actuarial science and catastrophe modelling.

Figure 2— Loss Exceedance Curve
Organizations can follow each risk along the curve and draw conclusions. In this example, practitioners can follow the line for ransomware and draw the following conclusions:
If a ransomware attack occurs, there is a 60% probability that losses will exceed US$20 million and a 20% probability losses will exceed US$60 million.
There is a less than 10% probability that ransomware losses will exceed US$95 million. This can be considered a worst-case outcome—a widespread, massive ransomware attack in which critical systems are affected.
The red dotted line represents the organization’s loss tolerance, which can be thought of as the red quadrants in the risk matrix. It represents more risk than the organization is comfortable with, therefore, leadership should reduce this risk through mitigation, transference, avoidance or some combination of all 3.
LECs are generated from common cyberrisk quantification (CRQ) models. OpenFAIR is one such model, but many others can be used in cyberrisk. In this case, the risk analyst would input probability and magnitude data from internal and external sources into the model and run a set number of simulations. For example, the model can be set to run 100,000 iterations, which is equivalent to 100,000 years of the organization.
Once organizations have learned how to understand the LEC, a whole new world of data interpretation becomes available. The first step in understanding the LEC is to compare how a single risk is visualized on the risk matrix vs. the LEC.
In figure 1, the risk matrix leads viewers to believe that there is 1 outcome from a ransomware attack: high risk, which is universally thought of as negative. However, the LEC shows that this is not the case. There is a wide range of possible outcomes, including losses from US$1 thousand to US$100 million. The range aligns with what is known about ransomware attacks. Losses vary greatly depending on many factors, including how many systems are compromised, when defenses detect the malware (e.g., before infection, during the attack, after the ransom demand) and if the attack is caught early enough to allow for an intervention. A single color in the risk matrix cannot communicate these subtleties, and leadership is missing out on essential investment decisions by not considering risk that exists in other colors of the risk matrix.
The LEC also enables meaningful conversations around project planning, investment decisions and deeper discussions on how to best respond to risk.
In this example, the risk matrix led the organization to believe that that the risk of ransomware and data compromise is the same (high) and that leadership should treat them equally when mitigation planning. However, the LEC shows that data compromise has higher projected losses than ransomware and by how much. Worst-case outcomes also occur at different probabilities. This difference is significant when deciding where on the curve to manage risk: most likely outcomes, worst-case outcomes or somewhere in between.
The LEC establishes a financial baseline for further analyses, such as cost/benefit, evaluating capital reserves for significant losses, evaluating insurance and control comparisons.
Conclusion
Increasingly, organizations are data-obsessed and use analysis and interpretation to make decisions, yet many still use one-dimensional tools such as the risk matrix to manage risk. It is an elephant in the proverbial decision-making room and a problem that is too big to ignore.
This article was previously published by ISACA on July 19, 2021. ©2021 ISACA. All rights reserved. Reposted with permission.

When the Experts Disagree in Risk Analysis
What do you do when one expert’s risk forecast is wildly different from the rest? This post breaks down the four common causes—and what to do when the black sheep in your risk analysis might actually be right.

Image credit: "Every family has a black sheep somewhere!" by foxypar4 is licensed under CC BY 2.0
Imagine this scenario: You want to get away for a long weekend and have decided to drive from Los Angeles to Las Vegas. Even though you live in LA, you've never completed this rite of passage, so you're not sure how long it will take given traffic conditions. Luckily for you, 5 of your friends regularly make the trek. Anyone would assume that your friends are experts and would be the people to ask. You also have access to Google Maps, which algorithmically makes predictions based on total miles, projected miles per hour, past trips by other Google Maps users, road construction, driving conditions, etc.

You ask your friends to provide a range of how long they think it will take you, specifically, to make the trip. They (plus Google) come back with this:
Google Maps: 4 hours, 8 minutes
Fred: 3.5 - 4.5 hours
Mary: 3 - 5 hours
Sanjay: 4 - 5 hours
Steven: 7 - 8 hours
Three of the four experts plus an algorithm roughly agree about the drive time. But, what's up with Steven's estimate? Why does one expert disagree with the group?
A Common Occurrence
Some variability between experts is always expected and even desired. One expert, or a minority of experts, with a divergent opinion, is a fairly common occurrence in any risk analysis project that involves human judgment. Anecdotally, I'd say about one out of every five risk analyses I perform has this issue. There isn't one single way to deal with it. The risk analyst needs to get to the root cause of the divergence and make a judgment call.
I have two sources of inspiration for this post. First, Carol Williams recently wrote a blog post titled Can We Trust the Experts During Risk Assessments? in her blog, ERM Insights, about the problem of differing opinions from experts when eliciting estimations. Second is the new book Noise by Daniel Kahneman, Olivier Sibony, and Cass R. Sunstein, covering the topic from a macro level. They define noise as "unwanted variability in judgments."
Both sources inspired and caused me to think about how, when, and where I see variability in expert judgment and what I do to deal with it. I've identified four reasons this may happen and how to best respond.
Cause #1: Uncalibrated Experts

Image credit: AG Pic
All measurement tools need to be calibrated, meaning the instrument is configured to provide accurate results within an acceptable margin of error. The human mind, being a tool of measurement, also needs to be calibrated.
Calibration doesn't make human expert judgment less wrong. Calibration training helps experts frame their knowledge and available data into a debiased estimate. The estimates of calibrated experts outperform uncalibrated experts because they have the training, practice, and learning about their inherent personal biases to provide estimates with a higher degree of accuracy.
Calibration is one of the first things I look for if an individual's estimations are wildly different from the group: have they gone through estimation and calibration training?
Solution
Put the expert through calibration training - self-study or formalized. There are many online sources to choose from, including Doug Hubbard's course and the Good Judgement Project's training.
Cause #2: Simple misunderstanding
Some experts simply misunderstand the purpose, scope of the analysis, research, or assumptions.
I was once holding a risk forecasting workshop, and I asked the group to forecast how many complete power outages we should expect our Phoenix datacenter to have in the next ten years, given that we’ve experienced two in the last decade. All of the forecasts were about the same - between zero and three. One expert came back with 6-8, which is quite different from everyone else. After a brief conversation, it turned out he misheard the question. He thought I was asking for a forecast on outages on all datacenters worldwide (over 40) instead of just the one in Phoenix. Maybe he was multitasking during the meeting. We aligned on the question, and his new estimate was about the same as the larger group.
You can provide the same data to a large group of people, and it's always possible that one or a few people will interpret it differently. If I aggregated this person's estimation into my analysis without following up, it would have changed the result and produced a report based on faulty assumptions.
Solution
Follow up with the expert and review their understanding of the request. Probe and see if you can find if and where they have misunderstood something. If this is the case, provide extra data and context and adjust the original estimate.
Cause #3: Different worldview

Your expert may view the future - and the problem - differently than the group. Consider the field of climate science as a relevant example.
Climate science forecasting partially relies on expert judgment and collecting probability estimates from scientists. The vast majority – 97% - of active climate scientists agree that humans are causing global warming. 3% do not. This is an example of a different worldview. Many experts have looked at the same data, same assumptions, same questions, and a small subgroup has a different opinion than the majority.
Some examples in technology risk:
A minority of security experts believe that data breaches at a typical US-based company aren't as frequent or as damaging as generally thought.
A small but sizable group of security experts assert that security awareness training has very little influence on the frequency of security incidents. (I'm one of them).
Some security risk analysts believe the threat of state-sponsored attacks to the typical US company is vastly overstated.
Solution
Let the expert challenge your assumptions. Is there an opportunity to revise your assumptions, data, or analysis? Depending on the analysis and the level of disagreement, you may want to consider multiple risk assessments that show the difference in opinions. Other times, it may be more appropriate to go with the majority opinion but include information on the differing opinion in the final write-up.
Keep in mind this quote:
"Science is not a matter of majority vote. Sometimes it is the minority outlier who ultimately turns out to have been correct. Ignoring that fact can lead to results that do not serve the needs of decision makers."
- M. Granger Morgan
Cause #4: The expert knows something that no one else knows
It's always possible that the expert that has a vastly different opinion than everyone else knows something no one else knows.
I once held a risk workshop with a group of experts forecasting the probable frequency of SQL Injection attacks on a particular build of servers. Using data, such as historical compromise rates, industry data, vuln scans, and penetration test reports, all the participants provided a forecast that were generally the same. Except for one guy.
He provided an estimate that forecasted SQL Injection at about 4x the rate as everyone else. I followed up with him, and he told me that the person responsible for patching those systems quit three weeks ago, no one is doing his job currently, and a SQL Injection 0-day is being actively used in the wild! The other experts were not aware of these facts. Oops!
If I ignored or included his estimates as-is, this valuable piece of information would have been lost.
Solution
Always follow up! If someone has extra data that no one else has, this is an excellent opportunity to share it with the larger group and get a better forecast.
Conclusion
Let's go back to my Vegas trip for a moment. What could be the cause of Steven's divergent estimate?
Not calibrated: He has the basic data but lacks the training on articulating that into a usable range.
Simple misunderstanding: "Oh, I forgot you moved from San Jose to Los Angeles last year. When you asked me how long it would take to drive to Vegas, I incorrectly gave you the San Jose > Vegas estimate." Different assumptions!
Different worldview: This Steven drives under the speed limit and only in the slow lane. He prefers stopping for meals on schedule and eats at sit-down restaurants - never a drive-through. He approaches driving and road trips differently than you do, and his estimates reflect this view.
Knows something that the other experts do not know: This Steven remembered that you are bringing your four kids that need to stop often for food, bathroom, and stretch breaks.
In all cases, a little bit of extra detective work finds the root cause of the divergent opinion.
I hope this gives a few good ideas on how to solve this fairly common issue. Did I miss any causes or solutions? Let me know in the comments below.
Further reading

My 2020 Predictions, Graded
I made 15 bold, measurable predictions for 2020—then graded myself against the results, calibration curve and all. Spoiler: I wasn’t as right as I thought, and the Electronic Frontier Foundation got a chunk of my money.

This post is a little bit overdue, but I’ve been looking forward to writing it. In December 2019, I made 15 predictions for 2020. I was inspired by two sources. First, Scott Alexander does yearly predictions with end-of-year grading - all plotted on a calibration curve. Scott inspired me to do the same. The second source of inspiration is all the end-of-year predictions that say a lot, but mean nothing. For example, “Ransomware will continue to be a problem.” Yeah. It’s obvious, but it’s also so vague that one can never be wrong. I want to do better.
I put a twist on my predictions. I wrote them to be measurable and completely gradable, after the fact - just like Scott Alexander. They pass The Clairvoyant Test (or, The Biff Test, if you please.) More importantly, I put my money where my mouth is.
It’s well-known in the field of expert judgment and forecasting that people make better predictions if they have something on the line. It’s why the Equivalent Bet Test works. I committed to donating $10 for every 10th of a decimal point I’m off from being perfectly calibrated. See the 2020 Prediction post for more info on the methodology.
How did I do?
I think I did just ok.
8 out of my 15 predictions came true - slightly more than half.
Based on my confidence levels, I believed I would get 11 right
In this set of forecasts, I am overconfident. People that are overconfident believe they are right more often than they actually are.
EFF will get $400 of my money as a donation
I have learned that yearly predictions, especially of macro trends, are very difficult. While a global pandemic should have been on everyone’s radar, predicting it a year before it happens is hard. COVID-19 tanked some of my forecasts.
Without further delay…
My 2020 Predictions, Graded
Facebook will ban political ads in 2020, similar to Twitter’s 2019 ban.
Confidence: 50%
Assessment: Wrong
Notes: Facebook did ban political ads, but not like Twitter, which was the benchmark. Facebook waited until after the November election to ban ads.By December 31, 2020 none of the 12 Russian military intelligence officers indicted by a US federal grand jury for interference in the 2016 elections will be arrested.
Confidence: 90%
Assessment: Right
Notes: All 12 intelligence officers are still on the FBI’s Most Wanted list.The Jabberzeus Subjects – the group behind the Zeus malware massive cyber fraud scheme – will remain at-large and on the FBI’s Cyber Most Wanted list by the close of 2020.
Confidence: 90%
Assessment: Right
Notes: They are still on the FBI’s Most Wanted list.The total number of reported US data breaches in 2020 will not be greater than the number of reported US data breaches in 2019. This will be measured by doing a Privacy Rights Clearinghouse data breach occurrence count.
Confidence: 70%
Assessment: Right
Notes: It feels like data breaches get exponentially worse year after year, but it’s not. I think we see numbers ebb and flow but with a general upward trend as the number of connected systems and the sheer number of records increase. 2019 was exceptionally bad, so it was reasonable to think that 2020 would be better.
The Privacy Rights Clearinghouse, unfortunately, doesn’t seem to be updating data breach numbers anymore so I took the numbers from the Identity Theft Resource Center.
2019 had 1,362 reported data breaches and 2020 had 1,108.The total number of records exposed in reported data breaches in the US in 2020 will not exceed those in 2019. This will be measured by adding up records exposed in the Privacy Rights Clearinghouse data breach database. Only confirmed record counts will apply; breaches tagged as “unknown” record counts will be skipped.
Confidence: 80%
Assessment: Right
Notes: Same reasoning as #6. 2019 had 887,286,658 records exposed and 2020 had 300,562,519 according to the Identity Theft Resource Center.One or more companies in the Fortune Top 10 list will not experience a reported data breach by December 31, 2020.
Confidence: 80%
Assessment: Right
Notes: Several companies on the list did not have a data breach.The 2020 Verizon Data Breach Investigations Report will report more breaches caused by state-sponsored or nation state-affiliated actors than in 2019. The percentage must exceed 23% - the 2019 number.
Confidence: 80%
Assessment: Wrong
Notes: Nope, way less than 23%.By December 31, 2020 two or more news articles, blog posts or security vendors will declare 2020 the “Year of the Data Breach.”
Confidence: 90%
Assessment: Right
Notes: This was kind of an inside joke to myself. Regular readers know that I like poking fun at marketing hyperbole and orgs using FUD to sell products. Every year since 2005 has been declared the “Year of the Data Breach” by a blogger, journalist, security vendor, etc. It seems to me that one year should be the “Year of the Data Breach,” not every year. The phrase means nothing now. I wrote about this here: Will the Real “Year of the Data Breach” Please Stand Up?”
Sure enough, none other than the Harvard Business Review declared 2020 the Year of the Data Breach. LOL.Congress will not pass a federal data breach law by the end of 2020.
Confidence: 90%
Assessment: Right
Notes: Did not happenBy midnight on Wednesday, November 4th 2020 (the day after Election Day), the loser in the Presidential race will not have conceded to the victor specifically because of suspicions or allegations related to election hacking, electoral fraud, tampering, and/or vote-rigging.
Confidence: 60%
Assessment: Right
Notes: I’m not some forecasting genius because I got this right. Trump has been saying this since 2016.Donald Trump will express skepticism about the Earth being round and/or come out in outright support of the Flat Earth movement. It must be directly from him (e.g. tweet, rally speech, hot mic) - cannot be hearsay.
Confidence: 60%
Assessment: Wrong
Notes: Really though, why not? Trump would say or do anything to pander for votes.Donald Trump will win the 2020 election.
Confidence: 80%
Assessment: Wrong
Notes: Without the pandemic and botched response, I think he would have won.I will submit a talk to RSA 2021 and it will be accepted. (I will know by November 2020).
Confidence: 50%
Assessment: Wrong
Notes: The pandemic sapped my will to do many things extracurricular, not to mention that RSA as a conference has lost a lot of its appeal to me. I didn’t even submit.On or before March 31, 2020, Carrie Lam will not be Chief Executive of Hong Kong.
Confidence: 60%
Assessment: Wrong
Notes: Back in 2019, I thought Hong Kong independence would be THE BIG story for 2020. I was wildly wrong.By December 31, 2020 the National Bureau of Economic Research (NBER) will not have declared that the US is in recession.
Confidence: 70%
Assessment: Wrong
Notes: I was wrong.
Final Thoughts
This was really fun and I think I’ll do it again. I didn’t do any 2021 - I had too much going on in December to even think about this. If you have been through calibration training or perform forecasts on any level as part of your job, I think you should try this - even if you keep the results to yourself. It will help you improve your estimations and forecasts in the long run.

Using Risk Assessment to Support Decision Making
Risk assessments only matter when tied to real decisions—but too often, they're done out of habit, not purpose. Learn how to anchor your analysis in actual choices, preferences, and available information to drive meaningful action.

"Construction Signs" by jphilipg is licensed under CC BY 2.0
An effective and mature risk governance program drives better decision making in all directions of an organization: up to leadership and the board, down to individual contributors and laterally to all lines of business. Risk-aware decision making, regardless of the domain (e.g., finance, technology, enterprise, cyber), is the cornerstone of effective resource management at any organization.
COBIT® 5 for Risk defines a risk assessment as “[T]he process used to identify and qualify or quantify risk and its potential effects,” describing the identification, scoping, analysis and control evaluation. Successful organizations integrate the entire risk management life cycle process with business decision making, but how do they do so? First, the organization must know what a decision is and how decisions drive risk assessment activities—not the other way around. After this is understood, the rest of the pieces fall into place.
What Is a Decision?
Without a decision, a risk assessment is, at best, busywork. At worst, it produces an unfocused, time-intensive effort that does not help leaders achieve their objectives. Information risk professionals operate in a fast, ever-changing and often chaotic environment, and there is not enough time to assess every risk, every vulnerability and every asset. Identifying the underlying decision driving the risk assessment ensures that the activity is meaningful, ties to business objectives and is not just busywork.
The idea that risk analysis helps decision making by reducing uncertainty is as old as probabilistic thinking itself. The concept was formalized by Ron A. Howard, a decision science professor at Stanford University (California, USA), in his influential 1963 paper, Decision Analysis: Applied Decision Theory.1 He formalized and defined the components of a decision, all of which can be used to focus risk assessment activities.
Components of a Decision
Howard identifies 3 components of a decision: choice, information and preference (figure 1).2 Together they are the foundation of decision-making; without all 3, a decision cannot be made. The decision maker uses logic to identify and evaluate the components individually and together, leading to a conclusion.

Figure 1—The Components of a Decision
Once the risk analyst understands the components and how they work together, it is easy to see how they support a risk decision:
Choice—This describes what the decision maker can do. There must be multiple courses of action possible for a decision to be made. With only one course of action, there is no decision.
Preference—The decision maker must have a preference or inclination for a desired outcome. For example, in information risk, the decision maker often prefers to optimize user functionality, effective security, efficient resource allocation (i.e., money, time, people) or some combination of these options. Understanding the requestor's preferences is a valuable exercise to help scope a risk assessment. The decision maker should be able to articulate what the requestor wants to achieve as an outcome of the decision.
Information—Information is an equal part of the trio when making a decision, and information is also an integral part of any risk assessment. When making a decision—and by extension, assessing risk—information is available from a variety of sources.
Framing a Risk Assessment as Decision Support
If any of these components are missing, there is no decision to be made and, by extension, a risk assessment will be an exercise in frustration that will not yield valuable results. If the risk analyst starts a risk assessment by identifying the choice, preference and information, the assessment will be easier to focus and scope. Alternately, one may conclude that a risk assessment is not necessary or a different methodology may be more appropriate.
ISACA’s Risk IT Framework, 2nd Edition describes 3 high-level steps in the risk assessment process:
Risk identification
Risk analysis
Evaluating the business impact(s) of the identified risk
Integrating the decision-making process into risk assessment steps requires the analyst to ask questions to understand the full scope of the decision before and during the risk identification phase. This provides the opportunity to align assessment activities with the organization’s strategic objectives.
Figure 2 provides a simple matrix that illustrates this.

Figure 2—Understanding the Decision Before and During Risk Identification
Real-World Examples
Here are 3 common examples of poorly scoped risk assessment requests and tips for the risk analyst to clarify the decision and determine if risk analysis is the right tool.
Risk Assessment Request 1
“An employee on the development team keeps unjoining his computer from the Active Directory Domain Service (AD DS) to avoid system updates and required device management. Can you perform a risk assessment on this so we can force the employee to stop doing it?"
What Is Missing?
Choice. There is not a clearly articulated choice or alternatives. The requestor is presenting only one choice: forcing an employee to do something specific. In other words, the requestor does not need help in deciding what to do.
What Is an Alternative Approach?
Management or human resources (HR) action and escalation are most appropriate here, assuming there is a written policy for security circumvention and IT management software uninstalls. A risk assessment would be appropriate here if there were a choice to be made such as, “Should the enterprise let users circumvent endpoint management, and, if so, what is the risk?” A risk assessment would help management weigh the risk and benefits and make a decision.
Risk Assessment Request 2
“We are evaluating 2 different antivirus vendors to replace our existing solution, and we need a risk assessment to help us decide.”
What Is Missing?
Preference. The decision maker has not expressed the desired outcome from the decision. Are there security concerns, cost savings or usability issues with the current solution? Without a clearly defined preference, the assessment will be unfocused and could analyze the wrong risk.
What Is an Alternative Approach?
Interviewing leadership and asking why they are considering switching vendors and what information needs to be included in the risk assessment will aid the decision. A requirements comparison matrix would be a good first step, comparing product features and potential security issues. After developing a list of gaps each product has, a risk assessment may be the best path forward, but it needs to be scoped. For example, a potential gap might be, "Product Y is cheaper than Product Z, but it is missing these 3 security features. What additional risk exposure would Product Y introduce to the organization?"
Risk Assessment Request 3
“I would like you to assess black swan cyberevents.”
What Is Missing?
Information. According to Nassim Taleb, who coined and popularized the term in the modern business context, a black swan event is an “outlier, as it lies outside the realm of regular expectations.”3 Only a true clairvoyant can look into the future and predict events that are unknowable today.
What Is an Alternative Approach?
The decision maker may be misunderstanding the term “black swan.” It would be useful to ask, “Do you mean high-impact, low-probability events?” If that is the case, a series of risk assessments can be performed to identify control weaknesses that affect business resilience.
Conclusion
Risk assessments are an excellent tool to reduce uncertainty when making decisions, but they are often misapplied when not directly connected to an overall decision-making process. The failure to frame a risk assessment as decision support, supported by the 3 decision components, decouples the analysis effort from business objectives. Time is wasted by performing assessments when there is not a decision to be made, when there is a lack of complete information or when there is no understanding of the preference of the individuals responsible for the decisions. Having clear, complete information and understanding the motivations and options behind a decision help frame the assessment in a meaningful manner.
This understanding will help develop a response the next time someone drops off a 170-page vulnerability scan report and asks for a risk assessment on it.
Endnotes
1 Howard, R. A.; “Decision Analysis: Applied Decision Theory,“ Proceedings of the Fourth International Conference on Operational Research,” 1966
2 Edwards, W.; R. F. Miles, Jr.; D. Von Winterfeldt (eds.).; Advances in Decision Analysis: From Foundations to Applications, Cambridge University Press, USA, 2007
3 Taleb, N. N.; “The Black Swan: The Impact of the Highly Improbable,” The New York Times, 22 April 2007
This article was previously published by ISACA on April 12, 2021. ©2021 ISACA. All rights reserved. Reposted with permission.

The Sweet Spot of Risk Governance
Effective risk governance lives in the sweet spot—between reckless risk-seeking and paralyzing risk aversion. Quantification helps strike that balance, aligning security investments with business value instead of just chasing every red box to green.

"Baseball Bats, MoMA 2, New York" by Rod Waddington is licensed under CC BY-SA 2.0
In baseball, the “sweet spot” refers to the precise location on a bat where the maximum amount of energy from a batter’s swing is shifted into the ball. It is an equilibrium—the best possible outcome proportional to the amount of effort the batter exerts. A similar concept exists in risk management. IT professionals want to find the best possible balance between risk seeking and risk avoidance. Too much risk seeking leads to an organization taking wild leaps of faith on speculative endeavors, potentially leading to business failure. Extreme risk aversion, on the other hand, causes an organization to fall behind emerging trends and market opportunities—cases in point: Polaroid and Blockbuster. Finding the right balance can move an organization’s risk program from an endless cycle of opening and closing entries on a risk register to a program that truly aligns with and promotes business objectives.
Risk Seeking
Risk is not necessarily bad. Everyone engages in risky behavior to achieve an objective, whether it is driving a car or eating a hot dog. Both activities cause deaths every year, but there is a willingness to take on the risk because of the perceived benefits. Business is no different. Having computers connected to the Internet and taking credit card transactions present risk, but not engaging in those activities presents even more risk: the complete inability to conduct business. Seeking new opportunities and accepting the associated level of risk is part of business and life.
Risk Avoidance
Identifying and mitigating risk is an area where risk managers excel, sometimes to the detriment of understanding the importance of seeking risk. This can be seen especially in information security and technology risk where the impulse is to mitigate all reds to greens, forgetting that every security control comes with an opportunity cost and potential end user friction. The connection between risk, whether seeking or avoiding, and business needs to be inexorably linked if a risk management program has any chance for long-term success.
Sweet Spot
Think of risk behavior as a baseball bat. A batter should not hit the ball on the knob or the end cap. It is wasted energy. One also does not want to engage in extreme risk seeking or risk avoidance behaviors. Somewhere in the middle there is an equilibrium. It is the job of the risk manager to help leadership find the balance between risk that enables business and risk that lies beyond an organization’s tolerance.
This can be done by listening to leadership, learning where the organization’s appetite for risk lies and selecting controls in a smart, risk-aware way. Security and controls are very important. They can mitigate serious, costly risk, but balance is needed.
Risk quantification is an indispensable tool in finding and communicating balance as it helps leadership understand the amount of risk exposure in an area, by how much security controls can reduce exposure and, perhaps most important, if the cost of controls are proportional to the amount of risk reduced. The balance is a crucial part of risk governance and helps leadership connect risk to its effect on business objectives in a tangible and pragmatic way.
This article was previously published by ISACA on April 5, 2021. ©2021 ISACA. All rights reserved. Reposted with permission.