
Book Chapter: Cyber Risk Quantification of Financial Technology
Fintech is revolutionizing finance, but it’s also rewriting the rulebook for cybersecurity and risk management. In this chapter from Fintech: Growth and Deregulation, I explore how quantitative methods like FAIR can help risk managers keep up with blockchain, decentralized trust models, and emerging threats—without falling back on outdated controls or red/yellow/green guesswork.
In February 2018, I wrote a chapter in a Risk.net book, titled Fintech: Growth and Deregulation. The book is edited by Jack Freund, who most of you will recognize as the co-author of Measuring and Managing Information Risk.
I happy to announce that I’m now able to re-post my book chapter, titled “Cyber-risk Quantification of Financial Technology” here. If you are interested in blockchain tech, Fintech, risk quantification and emerging risks, you may find it interesting. It’s also a primer to Factor Analysis of Information Risk (FAIR), one of many risk quantification models. It’s not the only one I use, but the one I use most frequently.
I covered the main ideas at the PRMIA Risk Management event in a talk titled Cybersecurity Aspects of Blockchain and Cryptocurrency (slides available in the link.)
You can buy the book here.
Hope you enjoy — and as always, if you have questions, comments or just want to discuss, drop me a line.
Chapter 13: Cyber Risk Quantification of Financial Technology
By Tony Martin-Vegue …from Fintech: Growth and Deregulation
Edited by Diane Maurice, Jack Freund and David Fairman
Published by Risk Books. Reprinted with permission.
Introduction
Cyber risk analysis in the financial services sector is finally catching up with its older cousins in financial and insurance risk. Quantitative risk assessment methodologies, such as Factor Analysis of Information Risk (FAIR), are steadily gaining traction among information security and technology risk departments and the slow, but steady, adoption of analysis methods that stand up to scrutiny means cyber risk quantification is truly at a tipping point. The heat map, risk matrix and “red/yellow/green” as risk communication tools are being recognized as flawed and it truly couldn’t come at a better time. The field’s next big challenge is on the horizon: the convergence of financial services and rapidly evolving technologies – otherwise known as Fintech – and the risks associated with it.
Fintech has, in many ways, lived up to the hype of providing financial services in a way that traditional firms have found too expensive, too risky, insecure or cost prohibitive. In addition, many Fintech firms have been able to compete with traditional financial services by offering better products, quicker delivery and much higher customer satisfaction. The rapid fusion of technology with financial services also signals a paradigm shift for risk managers. Many of the old rules for protecting the confidentiality, integrity and availability of information assets are being upended and the best example of this is how the defence-in-depth model is an outdated paradigm in some situations. For decades, sound security practices dictated placing perimeter defences, such as firewalls and intrusion detection systems around assets like a moat of water surrounding a castle; iron gates stopping intruders from getting in with defenders on the inside, at the ready to drop hot oil. This metaphor made sense when assets were deployed in this way; database server locked in a server rack in a datacentre, surrounded by a ring of protective controls.
In the mid-2000’s, cloud computing technologies became a household name and risk managers quickly realized that the old defensive paradigms no longer applied. If cloud computing blurs the line between assets and the network perimeter, technologies used in Fintech, such as blockchain, completely obliterate it. Risk managers adapted to new defensive paradigms in 2006, and the same must be done now. For example, the very notion of where data is stored is changing. In the defence-in-depth model, first line, second line and third line defenders worked under the assumption that we want to keep a database away from the attackers, and accomplish this using trust models such as role-based access control. New models are being deployed in Fintech in which we actively and deliberately give data and databases to all, including potential attackers, and rely on a radically different trust model, such as the distributed ledger, to ensure the confidentiality and integrity of data.
The distributed ledger and other emerging technologies in Fintech do not pose more or less inherent risk than other technologies, but risk managers must adapt to these new trust and perimeter paradigms to effectively assess risk. Many firms in financial services are looking to implement these types of technologies so that business can be conducted faster for the customer, cheaper to implement and maintain, and increase the security posture of the platform. If risk managers approach emerging technologies with the same defence-in-depth mentality as they would a client-server model, they have the possibility of producing a risk analysis that drastically overstates or understates risk. Ultimately, the objective of a risk assessment is to inform decisions, therefore we must fully understand the risks and the benefits of some of these new technologies emerging in Fintech, or it may be hard to realize the rewards.
This chapter will explore emerging risks, new technologies and risk quantification in the Fintech sector with the objective of achieving better decisions – and continuing to stay one step ahead of the behemoth banks. The threat landscape is evolving just as fast – and sometimes faster – than the underlying technologies and control environments. The best way to articulate risk in this sector is through risk quantification. Not only is risk quantification mathematically sounder than the softer, qualitative risk methodologies, but it enables management to perform cost-benefit analysis of control implementation and reporting of risk exposure in dollars, euros or pounds, which our counterparts in financial and insurance risk are already doing. The end result is an assessment that prioritises risk in a focused, defensible and actionable way.
Emerging Risks in Fintech
History has demonstrated repeatedly that new innovations breed a new set of criminals, eager to take advantage of emerging technologies. From lightning-fast micropayments to cryptocurrency, some companies that operate in the Fintech sector are encountering a renaissance in criminal activity that is reminiscent of the crime wave Depression-era outlaws perpetrated against traditional banks. Add an ambiguous regulatory environment and it’s clear that risk managers will be on the front line of driving well-informed business decisions to respond to these threats.
Financial services firms are at the forefront of exploring these emerging technologies. An example of this is blockchain technology designed to enable near real-time payments anywhere in the world. UBS and IBM developed a blockchain payment system dubbed “Batavia” and many participants have signed on, including Barclays, Credit Suisse, Canadian Imperial Bank of Commerce, HSBC, MUFG, State Street (Reuters 2017), Bank of Montreal, Caixabank, Erste Bank and Commerzbank(Arnold 2017). The consortium is expected to launch its first product in late 2018. Other financial services firms are also exploring similar projects. Banks and other firms find blockchain technology compelling because it helps improve transaction speed, security and increase transparency, hence strengthening customer trust. Financial regulators are also looking at the same technologies with a watchful eye; regulators from China, Europe and the United States are exploring new guidance and regulations to govern these technologies. Banks and regulators are understandably cautious. This is uncharted territory and the wide variety of possible risks are not fully known. This trepidation is justified as there have been several high-profile hacks in the banking sector, blockchain and Bitcoin.
Some emerging risks in Fintech are:
Bank Heists, with a new spin
The Society for Worldwide Interbank Financial Telecommunication, also known as SWIFT, provides a secure messaging for over 11,000 financial institutions worldwide(Society of Worldwide Interbank Financial Telecommunication 2017), providing a system to send payment orders. SWIFT, in today’s context, would be considered by many to be anything but “Fintech” – but taking into account it was developed in 1973 and considering the system was, up until recently, thought of as being very secure – it is a stellar example of financial technology.
In 2015 and 2016 dozens of banks encountered cyberattacks that lead to massive theft of funds, including a highly-publicised incident in which $81 million USD was stolen from a Bangladesh bank (Corkery 2016). The attacks were sophisticated and used a combination of compromised employee credentials, malware and a poor control environment (Zetter 2016)to steal the funds in a matter of hours. Later analysis revealed a link between the SWIFT hack and a shadowy hacking group, dubbed by the FBI as “Lazarus.” Lazarus is also suspected in the 2014 Sony Pictures Entertainment hack. Both hacks and Lazarus have been linked to North Korea government (Shen 2016). If attribution to North Korea is true, is it the first known instance in which a nation-state actor has stolen funds from a financial institution with a cyberattack. Nation-state actors, in the context of threat modelling and risk analysis, are considered to be very well-resourced, sophisticated, trained and operate outside the rule of law that may deter run-of-the-mill cybercriminals. As such, assume that nation-states can overcome any set of controls that are put in place to protect funds and data. State-sponsored attacks against civilian targets is a concerning escalation and should be followed and studied closely by any risk manager in Fintech. The SWIFT hacks are an example of how weaknesses in payment systems can be exploited again and again. The underlying SWIFT infrastructure is also a good case study in how Fintech can improve weak security in payment systems.
Forgetting the Fundamentals
Fintech bank heists aren’t limited to technology first developed in 1973, however. Take the case of the Mt. Gox Bitcoin heist: one of the first and largest Bitcoin exchanges at the time had 850,000 Bitcoin stolen in one day. At the time of the theft, the cryptocurrency was valued at $450 million USD. As of October 2017, the value of 850,000 Bitcoin is $3.6 trillion USD. How did this happen? Details are still murky, but the ex-CEO of Mt. Gox blamed hackers for the loss, others blamed the CEO, Mark Karpeles; the CEO even did time in a Japanese jail for embezzlement (O'Neill 2017). There were other issues, however: according to a 2014 story in Wired Magazine, ex-employees described a company in which there was no code control, no test code environment and only one person that could deploy code to the production site: the CEO himself, Mark Karpeles. Security fixes were often deployed weeks after they were developed (McMillian 2014). Fintech’s primary competitive advantage is that they have less friction than traditional financial services, therefore are able to innovate and push products to market very quickly. The downside the Mt. Gox case proves is when moving quickly, one cannot forget the fundamentals. Fundamentals, such as code change/version control, segregation of duties and prioritizing security patches should not be set aside in favour of moving quickly. Risk managers need to be aware of and apply these fundaments to any risk analysis and also consider that what makes technologies so appealing, such as the difficulty in tracing cryptocurrency, is also a new, emerging risk. It took years for investigators to locate the stolen Mt. Gox Bitcoin, and even now, there’s little governments or victims can do to recover them.
Uncertain regulatory environment
Fintech encompasses many technologies and many products, and as such, is subject to different types of regulatory scrutiny that vary by jurisdiction. One example of this ambiguous regulatory environment is the special Fintech Charter being considered by the Comptroller of the Currency (OCC), of the banking regulator in the United States. The charter will allow some firms to offer financial products and services without the regulatory requirements associated with a banking charter (Merken 2017). This may be desirable for some firms, as it will offer a feeling of legitimacy to customers, shareholders and investors. However, other firms may see this as another regulatory burden that stifles innovation and speed. Additionally, some firms that would like to have a Fintech charter may not have the internal IT governance structure in place to consistently comply with requirements. This could also result in future risk; loss of market share, regulatory fines and judgements and bad publicity due to a weak internal control environment.
It is beyond the scope of this chapter to convince the reader to adopt a quantitative risk assessment methodology such as Factor Analysis of Information Risk (FAIR), however, consider this: in addition to Fintech Charters, the OCC also released an “Advanced Notice of Proposed Rulemaking” on Enhanced Cyber Risk Management Standards. The need for improved cyber risk management was argued in the document, and FAIR Institute’s Factor Analysis of Information Risk standard and Carnegie Mellon’s Goal-Question-Indicator-Metric process are specifically mentioned (Office of the Comptroller of the Currency 2016). Risk managers in Fintech should explore these methodologies if their firm has a banking charter, may receive a special-purpose Fintech charter or are a service provider for a firm that has a charter.
Poor risk management techniques
We’re an emerging threat.
As mentioned many times previously, technology is rapidly evolving and so is the threat landscape. Practices, such as an ambiguous network perimeter and distributed public databases were once unthinkable security practices. They are now considered sound and, in many cases, superior methods to protect the confidentiality, integrity and availability of assets. Risk managers must adapt to these new paradigms and use better tools and techniques of assessing and reporting risk. If we fail to do so, our companies will not be able to make informed strategic decisions. One of these methods is risk quantification.
Case Study #1: Assessing risk of Blockchain ledgers
Consider a start-up payments company that is grappling with several issues: payments are taking days to clear instead of minutes; fraud on the platform exceeds their peers; and, a well-publicised security incident several years prior has eroded public trust.
Company leaders have started conversations around replacing the traditional relational database model with blockchain-based technology. Blockchain offers much faster payments, reduces the firm’s foreign exchange risk, helps the business improve compliance with Know Your Customer (KYC) laws, and reduces software costs. Management has requested a risk assessment on the different operating models of the blockchain ledger, expecting enough data to perform a cost-benefit analysis.
After carefully scoping the analysis, three distinct options have been identified the firm can take:
Stay with the current client-server database model. This does not solve any of management’s problems, but does not expose the company to any new risk either.
Migrate the company’s payments system to a shared public ledger. The trust model completely changes: anyone can participate in transactions, as long as 51% of other participants agree to the transaction (51% principle). Over time, customer perceptions may improve due to the total transparency of transactions, however, the question of securing non-public personal information (NPI) needs to be examined. Furthermore, by making a payments system available to the public that anyone can participate in, the firm may be reducing their own market share and a competitive differentiator needs to be identified.
The firm can adopt a private blockchain model: participation by invitation only, and in this case, only other payments companies and service providers can participate. This is a hybrid approach: the firm is moving from a traditional database to a distributed database, and the trust model can still be based on the 51% principle, but participation still requires authentication, and credentials can be compromised. Additionally, in some implementations, the blockchain can have an “owner” and owners can tamper with the blockchain.
It’s clear that this is not going to be an easy risk assessment, and the risk managers involved must do several things before proceeding. This is a pivotal moment for the company and make-or-break decisions will be based on the analysis, so red/yellow/green isn’t going to be sufficient. Second, traditional concepts such as defence-in-depth and how trust is established are being upset and adaptability is key. The current list of controls the company has may not be applicable here, but that does not mean the confidentiality, integrity and availability of data is not being protected.
Applying Risk Quantification to Fintech
Assessing risk in financial service, and in particular, Fintech, requires extra rigor. As a result, quantitative risk assessment techniques are being discussed in the cyber risk field. This chapter focuses on the Fair Institute’s Factor Analysis of Information Risk because it is in use by many financial intuitions world-wide, has many resources available to aid in implementation and is cited by regulators and used by financial institutions as a sound methodology for quantifying cyber risk (Freund & Jones, 2015). It’s assumed that readers do not need a tutorial on risk assessment, risk quantification or even FAIR; this section will walk through a traditional FAIR-based quantitative risk analysis that many readers are already familiar with and specifically highlight the areas where Fintech risk managers may need to be aware of, such as unique, emerging threats and technologies.
In FAIR, there are four distinct phases of an assessment: scoping the assessment, performing risk analysis, determining risk treatment and risk communication (Josey & et al, 2014). Each are equally important and have special considerations when assessing risk in Fintech.
Scoping out the assessment
Scoping is critical to lay a solid foundation for a risk assessment and saves countless hours during the analysis phase. An improperly scoped analysis may lead to examining the wrong variables or spending too much time performing an analysis, which is a common pitfall many risk managers make. Focus on the probable, not the possible (possibilities are infinite – is it possible that an alien invasion can affect the availability of your customer database by vaporizing your datacentre?)
Scoping is broken down into four steps: identifying the asset(s) at risk, identifying the threat agent(s) that can act against the identified assets, describe the motivation, and lastly, identify the effect the agent has on business objectives. See Figure 1 for a diagram of the process.
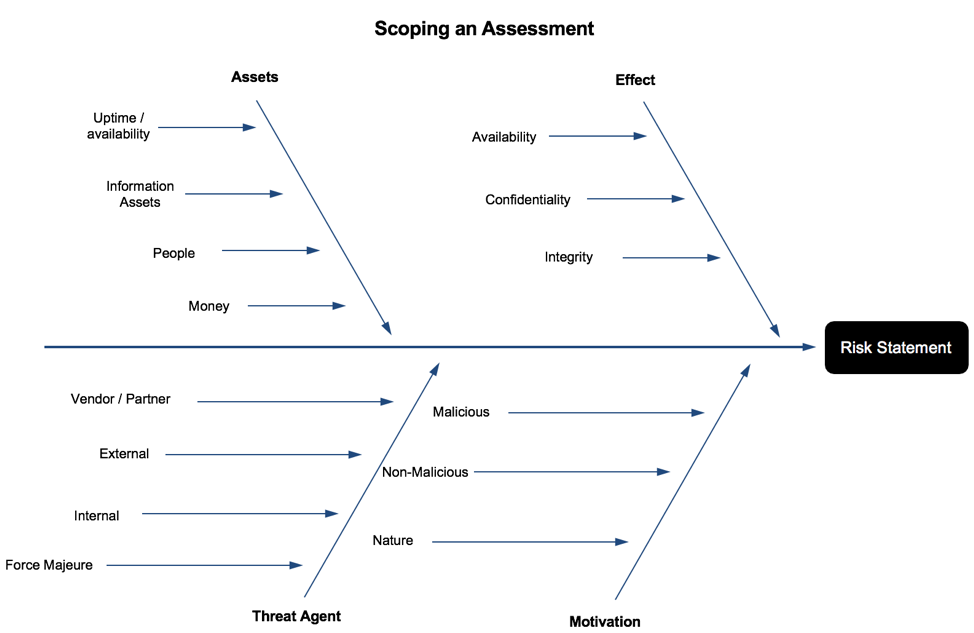
Figure 1: Scoping an Assessment
Step 1: Identify the asset(s) at risk
Broadly speaking, an asset in the cybersecurity sense is anything that is of value to the firm. Traditionally, hardware assets, such as firewalls, servers and routers are included in every risk analysis, but in Fintech – where much of the services provided are cloud-based and on virtual hardware, uptime/availability is an additional metric. Downtime of critical services can almost always be measured in currency. There are several other assets to consider: money (e.g. customer funds), information assets (e.g. non-public personal information about the customer) and people. People, as an asset, are almost always overlooked but should be included for the sake of modelling threats and designing controls, both of which can impact human life and safety. Keep in mind that each asset requires a separate analysis, so scope in only the elements required to perform an analysis.
Understanding emerging technologies that enable Fintech is a crucial part of a risk managers job. It’s relatively easy to identify the asset – what has value to a company – when thinking about the client-server model, datacentres, databases and currency transactions. This becomes difficult when assets are less tangible, such as a database operating under the client-server model, running on a physical piece of hardware. Less tangible assets are what we will continue to find in Fintech, such as, data created by artificial intelligence, distributed public ledgers and digital identities.
Step 2: Threat Agent Identification
Risk managers, in most cases, will need to break down threat agents further than shown in Figure 1, but the basic attributes that all threat agents possess are illustrated. More detail is given in the “Threat Capability” portion of this section.
All risk must have a threat. Think of a very old house that was built in 1880’s. It has a crumbling, brick foundation sitting on top of sandy dirt. Load-bearing beams are not connected to the ground. In other words, this house will fall like a house of cards if a strong earthquake were to hit the area. Some analysts would consider this a significant risk, and immediately recommend mitigating controls: replace the brick foundation with reinforced concrete, bolt the house to the new foundation and install additional vertical posts to load-bearing beams.
These controls are very effective at reducing the risk, but there is an important data point that the analyst hasn’t asked: What is the threat?
The house is in the US state of Florida, which is tied with North Dakota as having the fewest number of earthquakes in the continental US (USGS n.d.), therefore other sources of threat need to be investigated.
Without identifying the threat agent before starting a risk analysis, one may go through a significant amount of work just to find there isn’t a credible threat, therefore no risk. Even worse, the analyst may recommend costly mitigating controls, such as an earthquake retrofit, when protection from hurricanes is most appropriate in this situation.
There are generally two steps when identifying threat agents: 1) use internal and external incident data to develop a list of threats and their objectives, and 2) analyse those threats to ascertain which ones pose a risk to Fintech firms and how the threat agents may achieve their objectives.
Firms in the Fintech sector have many of the same threat agents as those that operate in Financial Services, with a twist: as the portmanteau suggests, Fintech firms often have threat agents that have traditionally targeted financial services firms, such as cybercriminal groups. Cyber criminals have a vast array of methods, resources and targets and are almost always motivated by financial gain. Financial services firms have also been targeted in the past by hacktivist groups, such as Anonymous. Groups such as this are motivated by ideology; in the case of Anonymous, one of their (many) stated goals was disruption of the global financial systems, which they viewed as corrupt. Distributed Denial of Service (DDoS) attacks are used to disrupt the availability of customer-facing websites, with some effect, but ultimately fail to force banks to enact any policy changes (Goldman 2016). Technology firms are also victims of cybercrime attacks, but unlike financial institutions, many have not drawn the ire of hacktivists. Depending on the type of technology a firm develops, they may be at an increased threat of phishing attacks from external sources and intellectual property theft from both internal and external threats.
Step 3: Describe the Motivation
The motivation of the threat actor plays is a crucial part in scoping out an analysis, and also helps risk managers in Fintech include agents that are traditionally not in a cyber risk assessment. For example, malicious agents include hostile nation-states, cybercriminals, disgruntled employees and hacktivists. As mentioned in the Emerging Risks in Fintech section earlier, risk managers would be remiss to not include Government Regulators as a threat agent. Consider Dwolla; the control environment was probably considered “good enough” and they did not suffer any loss events in the past due to inadequate security. However, government regulators caused a loss event for the company in the form of a fine, costly security projects to comply with the judgement and bad publicity. Additionally, consider accidental/non-malicious loss events originating from partners and third-party vendors, as many Fintech firms heavily rely on cloud-based service providers.
Step 4: Effect
Some things don’t change: security fundamentals are as applicable today as they were decades ago. Using the CIA Triad (confidentiality, integrity, availability) helps risk managers understand the form a loss event takes and how it affects assets. Threat agents act against an asset with a particular motivation, objective and intent. Walking through these scenarios – and understanding threat agents – helps one understand what the effect is.
Think about a threat agents’ goals, motivations and objectives when determining the effect. Hacktivists, for example, are usually groups of people united by political ideology or a cause. Distributed Denial of Service (DDoS) attacks have been used in the past to cause website outages while demands are issued to the company. In this case, the risk manager should scope in Availability as an effect, but not Confidentiality and Integrity.
Lastly: Writing Good Risk Statements
The end result is a well-formed risk statement that clearly describes what a loss event would look like to the organization. Risk statements should include all of the elements listed in steps 1-4 and describe the loss event, who the perpetrator is and what asset is being affected.
More importantly, the risk statement must always answer the question: What decision are we making? The purpose of a risk analysis is to reduce uncertainty when making a decision, therefore if at the end of scoping you don’t have a well-formed question that needs to be answered, you may need to revisit the scope, the purpose of the assessment or various sub-elements.
Case Study #2: Asset Identification in Fintech
A large bank has employed several emerging technologies to create competitive differentiators. The bank is moving to application programming interfaces (APIs) to move data to third parties instead of messaging (e.g. SWIFT). The bank is also employing a private blockchain and is innovating in the area of creating digital identities for their customers. A risk assessment of these areas requires inventive analysis to even complete the first step, asset identification.
When performing a risk analysis, the first question to ask is “What is the asset we’re protecting?” Besides the obvious, (money, equipment, data containing non-public personal information (NPI) firms that employ Fintech assets may often be less obvious. If the risk analyst is stuck, utilise information security fundamentals and break the problem down into smaller components that are simpler to analyse. In the case of the large bank employing new technologies, consider how the confidentiality, integrity and availability (CIA) can be affected if a loss event were to take place.
Confidentiality and integrity in a blockchain ledger can be affected if the underlying technology has a vulnerability. Blockchain technology was built from the ground up with security in mind using secret sharing; all the pieces that make up data are random and obfuscated. In a client-server model, an attacker needs to obtain a key to compromise encryption; with blockchains, an attacker needs to compromise the independent participant servers (depending on the implementation, this can be either 51% of servers or all the servers). The “asset” has shifted from something in a datacentre to something that is distributed and shared.
By design, blockchain technology improves availability.The distributed, decentralized nature of it makes it very resilient to outages. The asset in this case has also shifted; if uptime/availability is an asset due to lost customer transactions, this may not occur after the bank is done with the distributed ledger implementation. Risk may be overstated if this is not considered.
Case Study #3: Government regulators as a threat agent
In addition to the uncertain future with Fintech charters and the regulatory compliance risk it poses, the security practices of a US-based online payments platform start-up named Dwolla is also an interesting case study in regulatory action that results in a loss event. The Consumer Financial Protection Bureau (CFPB), a US-based government agency responsible for consumer protection, took action against Dwolla in 2016 for misrepresenting the company’s security practices. The CFPB found that “[Dwolla] failed to employ reasonable and appropriate measures to protect data obtained from consumers from unauthorized access” (United States Consumer Financial Protection Bureau 2016).
The CFPB issued a consent order and ordered the firm to remediate security issues and pay a $100,000 fine(Consumer Financial Protection Bureau 2016). This was the first action of this kind taken by the CFPB, which was created in 2014 by the Dodd-Frank Wall Street Reform and Consumer Protection Act. More interestingly, however, is that that action was taken without harm. Dwolla did not have a data breach, loss of funds or any other security incident. The CFPB simply found what the company was claiming about their implemented security practices to be deceptive and harmful to consumers. Risk managers should always build regulatory action into their threat models and consider that regulatory action can originate from consumer protection agencies, not just banking regulators.
Another interesting piece of information from the CFPB’s consent order is the discovery that “[Dwolla] failed to conduct adequate, regular risk assessments to identify reasonably foreseeable internal and external risks to consumers’ personal information, or to assess the safeguards in place to control those risks.” The risk of having incomplete or inadequate risk assessments should be in every risk manager’s threat list.
Performing the analysis
After the assessment is scoped, take the risk statement and walk through the FAIR taxonomy (figure 2), starting on the left.
Determine the Loss Event Frequency first which, in the FAIR taxonomy, is the frequency at which a loss event occurs. It is always articulated in the form of a period of time, such as “4x a month.” Advanced analysis includes a range, such as “Between 1x a month and 1x year.” This unlocks key features of FAIR that are not available in some other risk frameworks used in cyber risk: PERT distributions and Monte Carlo simulations. This allows the analyst to articulate risk in the form of ranges instead of a single number or colour (e.g. red.)
The Loss Event Frequency is also referred to as “Likelihood” in other risk frameworks. The Loss Event Frequency is a calculation of the Threat Event Frequency which is the frequency at which a threat agent acts against an asset, and the Vulnerability, which is a calculation of the assets’ ability to resist the threat agent. The Vulnerability calculation is another key differentiator of FAIR and will be covered in-depth shortly.
Loss Magnitude, sometimes called “Impact” in other risk frameworks, is the probable amount of loss that will be experienced after a loss event. The Loss Magnitude is comprised of Primary Loss, which is immediate losses, and Secondary Loss, which can be best described as fallout or ongoing, costs resulting from the loss event.
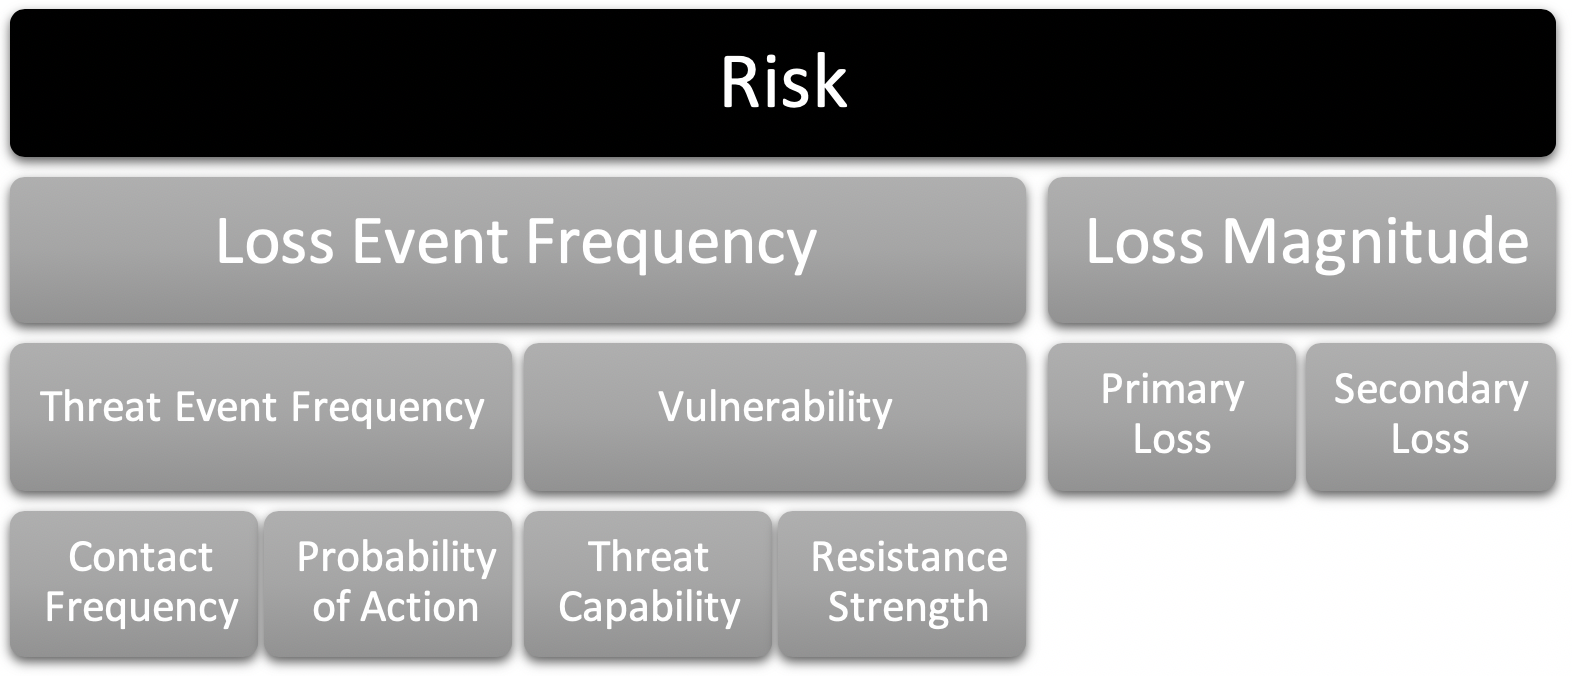
Figure 2: The FAIR taxonomy
Step 1: Derive the Threat Event Frequency
The scoping portion of the assessment includes a fair amount of work on threat agent modelling, so it is easiest to start there with the analysis. With the threat agent identified, the next step is to ascertain the frequency the threat agent will act against our asset.
FAIR also utilises calibrated probability estimates. When dealing with possible future events, it is not possible to say with exact certainty the frequency of occurrence. After all, we don’t have a crystal ball, nor do we need one. The purpose of a risk assessment is not to tell the future; it is to reduce uncertainty about a future decision. Calibrated probability estimates provide a way for subject matter experts to estimate probabilities while providing a means to express uncertainty. For example, a subject matter expert can state that a web application attack against a Fintech firm can occur between 1x a year and once every 5 years, with an 90% confidence interval. Confidence interval is a term used in statistics, meaning that the analyst is 90% certain the true answer falls within the range provided. Combining calibrated probability estimates with an analysis of past incidents, risk managers can be remarkably effective at forecasting a frequency of future threat events in a range.
Calibrated probability estimates have been used successfully in other fields for decades. Weather forecasts, for example, use calibrated probability estimates when describing the chance of rain within a period of time. Risk managers working in Fintech will find this method very effective because we are asked to describe risks that may not have happened before. In this case, a calibrated probability estimate allows the risk manager to articulate their level of uncertainty about a future event.
Contact Frequency describes the number of times a threat agent comes into contact with an asset and the Probability of Action describes the probability the threat agent will act against the asset.
Step 2: Derive the Vulnerability
Vulnerability is made up of two components: threat capability and resistance strength. These two concepts are usually discussed and analysed separately, but they are so intertwined with each other, that it may be easier to understand them as relational and even symbiotic (figure 3).
Threat Capability is a scale, between 1% and 100% given to a single agent in relation to the total population of threat agents that can cause loss events at your firm. The list of threat agents, often called a Threat Agent Library, can include everything from cyber criminals, nation states, hacktivists, natural disasters, untrained employees, government regulators and much more. Motivation, resources, objectives, organization and other attributes are considered when giving each agent a threat capability. The entire population of threat agents, with capability ratings, is called a threat continuum.
Resistance strength is also a percentage, between 1% and 100%, and is a way of measuring all the controls in place to protect an asset. The entire threat continuum is used as a benchmark to then give a range to how effective resistance strength is.
There are special considerations a Fintech risk manager must consider when assessing threat capability in a continuum and the corresponding resistance strength.
The threat landscape is constantly changing and evolving; think back to one of the first viruses that was distributed on the Internet, the Morris worm in 1988. A coding error in the virus turned something that was meant to be an experiment to measure the size of the Internet into a fast spreading worm that resulted in denial of service events on 10% of the Internet. Fast forward to today and the Morris worms seems quaint in retrospect. Militaries train cyber warriors for both offensive and defensive capabilities. Cyber-criminal organizations are highly resourced, develop their own tools, and have a very high level of sophistication. The CIA and NSA have developed offensive tools that, in many ways, outpace commercially available defensive products. In what is now called the Shadow Brokers leaks, those tools were made available to the public, giving threat actors a set of tools that give unprecedented offensive capabilities.
How does a risk manager measure and articulate a complex threat landscape that has the following attributes?
Nation states have vast resources, operate outside the law, develop exploits in where vendors do not have a patch for (zero day exploits), and launch offensive attacks at each other, resulting in collateral damage to firms.
Hostile nation states have attacked firms with the objective of damaging the company or stealing money.
Zero day exploits have been leaked and cyber-criminal organizations use them unhampered until vendors release a fix, which takes weeks or months.
Rewards for criminal activity have never been greater; monetizing stolen personal information from data breaches is easy and rarely results in legal repercussions
The threat landscape is a constant ebb and flow: there may be an elevated state of activity due to a hostile nation state launching attacks or exploits tools released into the wild. There may also be a period of relative calm, such as when most vendors release patches for Shadow Brokers exploits and firms have applied them.
Not all risk models include an assessment of threat capability, favouring an assessment of the control environment exclusively to determine the likelihood of a loss event. These models miss an important attribute of assessing cyber risk: the likelihood of a loss event growing and shrinking due to external forces, even if the control environment stays exactly the same. To understand this concept, one must understand the relationship between threat actors and controls.
A control is an activity that prevents or detects events that result in risk. Controls can be preventative, detective, corrective, deterrent, aid in recovery and compensating. Other disciplines, such as IT Audit, consider controls as something that operate in a vacuum: they are designed to perform a function, and they either operate effectively or they do not. For example, if we designed a flimsy door to be secured with a single lock on the door knob and tested the control, it would pass – as long as the door was locked. The threat actor (burglar with a strong leg to push the door in) is not considered. Control testing has its place in the enterprise, but is not effective at articulating risk.
Rather than thinking about controls by themselves, consider the entire control environment as the ability to resist threat agents. In fact, it is for this reason FAIR calls this portion of the risk assessment resistance strength – it’s a holistic view of an ability of an asset to resist the force of a threat agent.
Work with your threat teams to develop a threat actor library. It will help you scope out a risk assessment, is reusable, pre-loads much of the work upfront, therefore making risk assessments faster. Plot actors on a threat continuum diagram to make resistance strength identification easier and update at least quarterly.
Step 3: Derive Loss Magnitude
Understanding Loss Magnitude, the damage, expenses and harm resulting from an event, is often one of the easier portions of a risk analysis because other employees in a typical firm have thought about many of these expenses, although not in the context of cyber risk. Many risk frameworks refer to this step as “Impact.” Loss magnitude is made up of two components: Primary Loss, direct cost and damages, and Secondary loss, which is best thought of as “fallout” after an event.
Some considerations for Fintech risk managers when determining the Loss Magnitude:
Productivity can be harmed if an event hampers revenue generation. Emerging technologies, such as artificial intelligence, highly resilient network and distributed ledgers can mitigate some of this risk, but risk may present itself in different ways. Business Continuity managers and department heads of product lines are good places to start ascertaining this.
Response costs can add up quickly managing a loss event, such as employing outside forensics, auditors, staff augmentation and legal consulting.
The cost of replacing an asset still exists, even with cloud computing and virtual machines that can be allocated in minutes. There may be costs involved for extra computing capacity or restoring from backup.
Fines and judgements may occur when regulatory agencies take action against the firm of or judgements from lawsuits from customers, shareholders or employees. The legal landscape can be understood by reading the SEC filings of similar firms, news reports and legal documents. Action in this category is mostly public and is easy to extrapolate to apply to a particular firm.
Competitive advantage describes loss of customer and/or revenue due to a diminished company position after a loss event. This takes many forms, including the inability to raise new capital, inability to raise debt financing and a reduction in stock price. Senior management may have this information and an estimate of the number of lost customers due to an event.
Reputation damage resulting from a loss event can be difficult to quantify, but calibrated estimates can still be made. Focus on the tangible losses that can occur rather than “reputation.” For example, if in the long-term, perceptions about the company are negatively changed, this can result in a reduction in stock price, lenders viewing the company as a credit risk, reduction in market growth and difficulty in recruiting/retaining employees.
Final Steps: Deriving, Reporting and Communicating Risk
The final steps in the risk assessment are beyond the scope of this chapter, which focuses on Fintech, emerging risks and special considerations for risk managers. The final risk is a calculation of the Loss Event Frequency and the Primary/Secondary Loss, and is articulated in the form of a local currency. It is in this phase that the risk manager works with stakeholders to identify additional mitigating controls, if applicable, and another analysis can be performed to determine the expected reduction in loss exposure. Risk reporting and communication is a crucial part of any analysis: stakeholders must receive the results of the analysis in a clear and easy to understand way so that informed decisions can be made.
Case Study #4: Poor research skews Threat Event Frequency
Supplementing calibrated probability estimates with internal incident data and external research is an effective way to improve accuracy and control bias when conducting risk assessments, particularly the Threat Event Frequency portion of an analysis.
A medium-sized London-based insurance firm is conducting cutting-edge research in the machine learning and cryptocurrency areas, with the hope that they will be able to offer more products at very competitive prices. Management is concerned with the threat of insiders (company employees, consultants and contractors) stealing this innovative work and selling it to competitors. The cyber risk management team is tasked with ascertaining the risk to the company and determine how the current security control environment mitigates this risk. After careful scenario scoping, the team proceeds to the Threat Event Frequency portion of the analysis and encounters the first problem.
The company hasn’t had any security events involving insiders, so internal historical data isn’t available to inform a calibrated probability estimate. Additionally, subject matter experts say they can’t provide a range of a frequency of threat agents acting against the asset, which is intellectual property, because they are not aware of an occurrence in the Fintech space. The cyber risk team has decided to cast a wider net and incorporate external research conducted by outside firms on insider threats and intellectual property theft and extrapolate the results and use it to inform the risk scenario under consideration. It is at this point that the risk team encounters their next problem: the research available is contradictory, sponsored by vendors offering products that mitigate insider threats and uses dubious methodology.
There is no better example of how poor research can skew risk analysis than how insider threats have been researched, analysed and reported. The risk managers at the insurance firm need to estimate the percentage of data breaches or security incidents caused by insiders and have found several sources.
The Clear Swift Insider Threat Index report reports that 74% of data breaches are caused by insiders (Clearswift 2017).
In contrast, the 2017 Verizon Data Breach Investigation Report puts the number at 25% (Verizon 2017).
The IBM Xforce 2016 Cyber Security Intelligence Index reports that 60% of data breaches are caused by insiders, but a non-standard definition of “insider” is used (IBM 2016). IBM considers a user clicking on a phishing email as the threat-source, whereas most threat models would consider the user the victim and sender/originator of the email as the threat agent.
The lesson here is to carefully vet and normalize any data sources. Failure to do so could significant underreport or over report risk, leading to poor decisions.
All analysis and research have some sort of bias and error, but risk managers need to be fully aware of it and control for it, when possible, when using it in risk assessments. Carefully vet and normalize any data sources - failure to do so could result in significantly underreporting or over reporting threat event frequency.
A good source of incident data is the Verizon Data Breach Investigations Report (DBIR). The DBIR uses real-world incident data from reported data breaches and partners that span sectors: government, private sector firms, education and many others. The DBIR uses statistical analysis to present information to the reader that can be easily consumed into risk analysis. Another great source of raw incident data is the Privacy Rights Clearinghouse, which maintains a database of data breaches in the United States. Basic analysis is performed, but risk managers can download all incident data into Microsoft Excel and run their own analysis. Simple analysis is useful, such as the number of data breaches in the last 5 years due to stolen equipment, and more sophisticated analysis can be run, such as Bayesian analysis to generate a probability distribution.
Other security research is derived from Internet-based surveys and sometimes uses dubious methodologies often conducted without a notion of statistical sampling or survey science. Unless your risk analysis includes opinion about a population of people (many risk analyses can include this with great effectiveness!) it is best to read disclosures and research the methodology sections of reports to ascertain whether or not the research analysed a survey of respondents or actual incident data. The latter is almost always preferable when trying to determine frequency and probability of attacks and attack characteristics.
Risk managers should proceed with extreme caution when quoting research based on surveys. The importance of vetting research cannot be overstated.
Conclusion
Financial technology opens up new doors, in many ways. It enables disruption in a sector that is ripe for it and offers consumers more choices, often for cheaper and more securely. These new doors also require a shift in thinking for risk managers. Some of the old rules have changed and building fortress-like defensive security perimeters either don’t apply or hamper innovation. Conversely, some security fundamentals, such as the basics of how controls are applied and the security objectives of confidentiality, integrity and availability have not changed.
While Fintech has diverged from and in many ways outpaced its parent industry, Finance, in consumer offerings, speed and innovation, it must be careful not to rely on the same security tools that its other parent, Technology, has traditionally relied on. In doing so Fintech risk will in effect remain in the dark ages. Risk managers in modern finance have relied on quantitative methods to analyse business risk for as long as the industry has existed, whereas Technology still largely relies on the “red/yellow/green” paradigm to discuss risk. Fintech risk managers have an opportunity to further the rigor and integrity of our profession by using quantitative methods fitting of our trade. The future - including technology, the regulatory environment and the sophistication of criminals - continues to evolve, so we must equip ourselves with the tools that will support us to keep pace.
Quantitative risk assessments, such as FAIR, are how we are going to best serve our firms, analyse risk and advise on the best return on investment for security controls.
Works Cited
Arnold, Martin. 2017. Banks team up with IBM in trade finance blockchain.4 October. Accessed October 6, 2017. https://www.ft.com/content/7dc8738c-a922-11e7-93c5-648314d2c72c.
Clearswift. 2017. Clearswift Insider Threat Index.Accessed October 1, 2017. http://pages.clearswift.com/rs/591-QHZ-135/images/Clearswift_Insider_Threat_Index_2015_US.pdf.
Consumer Financial Protection Bureau. 2016. CFPB Takes Action Against Dwolla for Misrepresenting Data Security Practices.2 March. https://www.consumerfinance.gov/about-us/newsroom/cfpb-takes-action-against-dwolla-for-misrepresenting-data-security-practices/.
Corkery, Michael. 2016. Once Again, Thieves Enter Swift Financial Network and Steal.12 May. Accessed June 27, 2017. https://www.nytimes.com/2016/05/13/business/dealbook/swift-global-bank-network-attack.html.
Freund, J., & Jones, J. (2015). Measuring and Managing Information Risk: A FAIR Approach.Walthan, MA, USA: Elsevier.
Goldman, David. 2016. Anonymous attacks Greek Central Bank and vows to take down more banks' sites.4 May. Accessed July 4, 2017. http://money.cnn.com/2016/05/04/technology/anonymous-greek-central-bank/index.html.
IBM. 2016. IBM Xforce 2016 Cyber Security Intelligence Index .Accessed May 5, 2017. https://www.ibm.com/security/data-breach/threat-intelligence-index.html.
Josey, A., & et al. (2014). The Open FAIR Body of Knowledge.Berkshire, UK: The Open Group.
McMillian, Robert. 2014. The Inside Story of Mt. Gox, Bitcoin's $460 Million Disaster.3 March. https://www.wired.com/2014/03/bitcoin-exchange/.
Mead, Rebecca. 2016. Learn Different.7 March. Accessed August 9, 2017. https://www.newyorker.com/magazine/2016/03/07/altschools-disrupted-education.
Merken, Sara. 2017. OCC Not Yet Ready to Offer Special Charters to Fintechs.03 September. Accessed September 14, 2017. https://www.bna.com/occ-not-yet-n57982087846/.
Office of the Comptroller of the Currency. 2016. Enhanced Cyber Risk Management Standards.Office of the Comptroller of the Currency, Washington, D.C.: United States Department of the Treasury.
O'Neill, Patrick Howeell. 2017. The curious case of the missing Mt. Gox bitcoin fortune.21 June. https://www.cyberscoop.com/bitcoin-mt-gox-chainalysis-elliptic/.
Reuters. 2017. Six big banks join blockchain digital cash settlement project.31 August. Accessed October 6, 2017. https://www.reuters.com/article/us-blockchain-banks/six-big-banks-join-blockchain-digital-cash-settlement-project-idUSKCN1BB0UA.
Shen, Lucinda. 2016. North Korea Has Been Linked to the SWIFT Bank Hacks.27 May. Accessed October 1, 2017. http://fortune.com/2016/05/27/north-korea-swift-hack/.
Society of Worldwide Interbank Financial Telecommunication. 2017. Introduction to SWIFT.Accessed October 1, 2017. https://www.swift.com/about-us/discover-swift?AKredir=true.
United States Consumer Financial Protection Bureau. 2016. Consent Order Dwolla Inc.02 March. Accessed July 02, 2017. http://files.consumerfinance.gov/f/201603_cfpb_consent-order-dwolla-inc.pdf.
USGS. n.d. USGS.Accessed September 1, 2017. https://earthquake.usgs.gov/learn/topics/megaqk_facts_fantasy.php.
Verizon. 2017. Verizon Data Breach Investigations Report.Accessed July 4, 2017. http://www.verizonenterprise.com/verizon-insights-lab/dbir/2017/.
Zetter, Kim. 2016. That Insane, $81M Bangledesh Bank Heist? Here's what we know.17 May. Accessed July 4, 2017. https://www.wired.com/2016/05/insane-81m-bangladesh-bank-heist-heres-know/.

Bring Uncertainty Back
Adjectives like “high” and “red” don’t belong in serious risk analysis. In this post, I explain why expressing uncertainty—through ranges and confidence intervals—is not only more honest, but far more useful when making decisions under uncertainty.

We need to bring uncertainty back to risk measurements.
Suppose I ask you to measure the wingspan of a Boeing 747. Right now, wherever you may be, with the knowledge and tools you have on hand. You may say this isn’t possible, but Doug Hubbard has taught us that anything can be measured, once you understand what measurement is. With that mental hurdle out of the way, you can now measure the wingspan of a Boeing 747.
There are two different approaches to this in modern business.
Option 1:Think about the size of a passenger jet and say, “Big.”

Technically, this answers my question. There’s a problem with this answer, however - it’s neither precise nor accurate. In everyday language, the words precise and accurate are used interchangeably. In areas of science where measurements are frequently used, they mean different things. Accurate means the measure is correct while precise means the measure is consistent with other measurements.
The word “big” is an adjective to describe an attribute of something, but without context or a frame of reference to make a comparison, it’s virtually meaningless. Furthermore, using an adjective in place of a measurement is a little dishonest. It’s true that we don’t know the exactwingspan of a 747. Besides, wingspans vary by model. However, we chose a word, “big,” that conveys precision, accuracy, and exactness, but is not any of those. If that wasn’t bad enough, we’ve completely obfuscated our level of uncertainty about our ability to estimate the wingspan of a 747.
Option 2:What Would Fermi Do?

Thinkers like Enrico Fermi and Doug Hubbard approach the problem differently. They – just like us – probably don’t know the wingspan of a 747 off the top of their heads. Just like Fermi estimated the number of piano tuners in Chicago simply by thinking through and decomposing the problem, we can do the same.
I’ve seen a 747 and even flown on one several times, so I have some frame of reference.
I'm 6'2," and I know a 747 is larger than me
A football playing field is 100 yards (300 feet), and I'm sure a 747's wingspan is smaller than a football field
My first estimate is between 6’2” and 300 feet – let’s improve this
I know what a Chevy Suburban looks like – they are 18 feet long. How many Suburbans, front to back, would equal a 747? Maybe…. 7 is a safe number. That’s 126 feet.
I’m going to say that the wingspan of a 747 is between 126’ and 300’.
Am I 90% sure that the actual number falls into this range (aka confidence interval)? Let me think through my estimations again. Yes, I am sure.
Let’s check our estimation against Google.

It’s a good measurement.
Two remarkable things happened here. Using the same of data as “big” – but a different mental model - we made a measurement that is accurate. Second, we expressed our uncertaintyabout the measurement - mainly, we introduced error bars.
One missing data point is whether or not the level of precisionis adequate. To answer this, we need to know why I asked for the measurement. Is it to win a pub trivia game or to build an airplane hangar to store a 747? Our minds are instruments of measurement. We may not be as accurate as a tape measure, which is not as accurate as a laser distance measurer, which is not as accurate as an interferometer. All instruments of measurement of have error bars. When determining the level of precision needed in a measurement, we always need to consider the cost of obtaining new information, if it’s relevant and if we need additional uncertainty reduction to make a decision.
If this seems like a nice story to you, but one that’s not too relevant - think again.
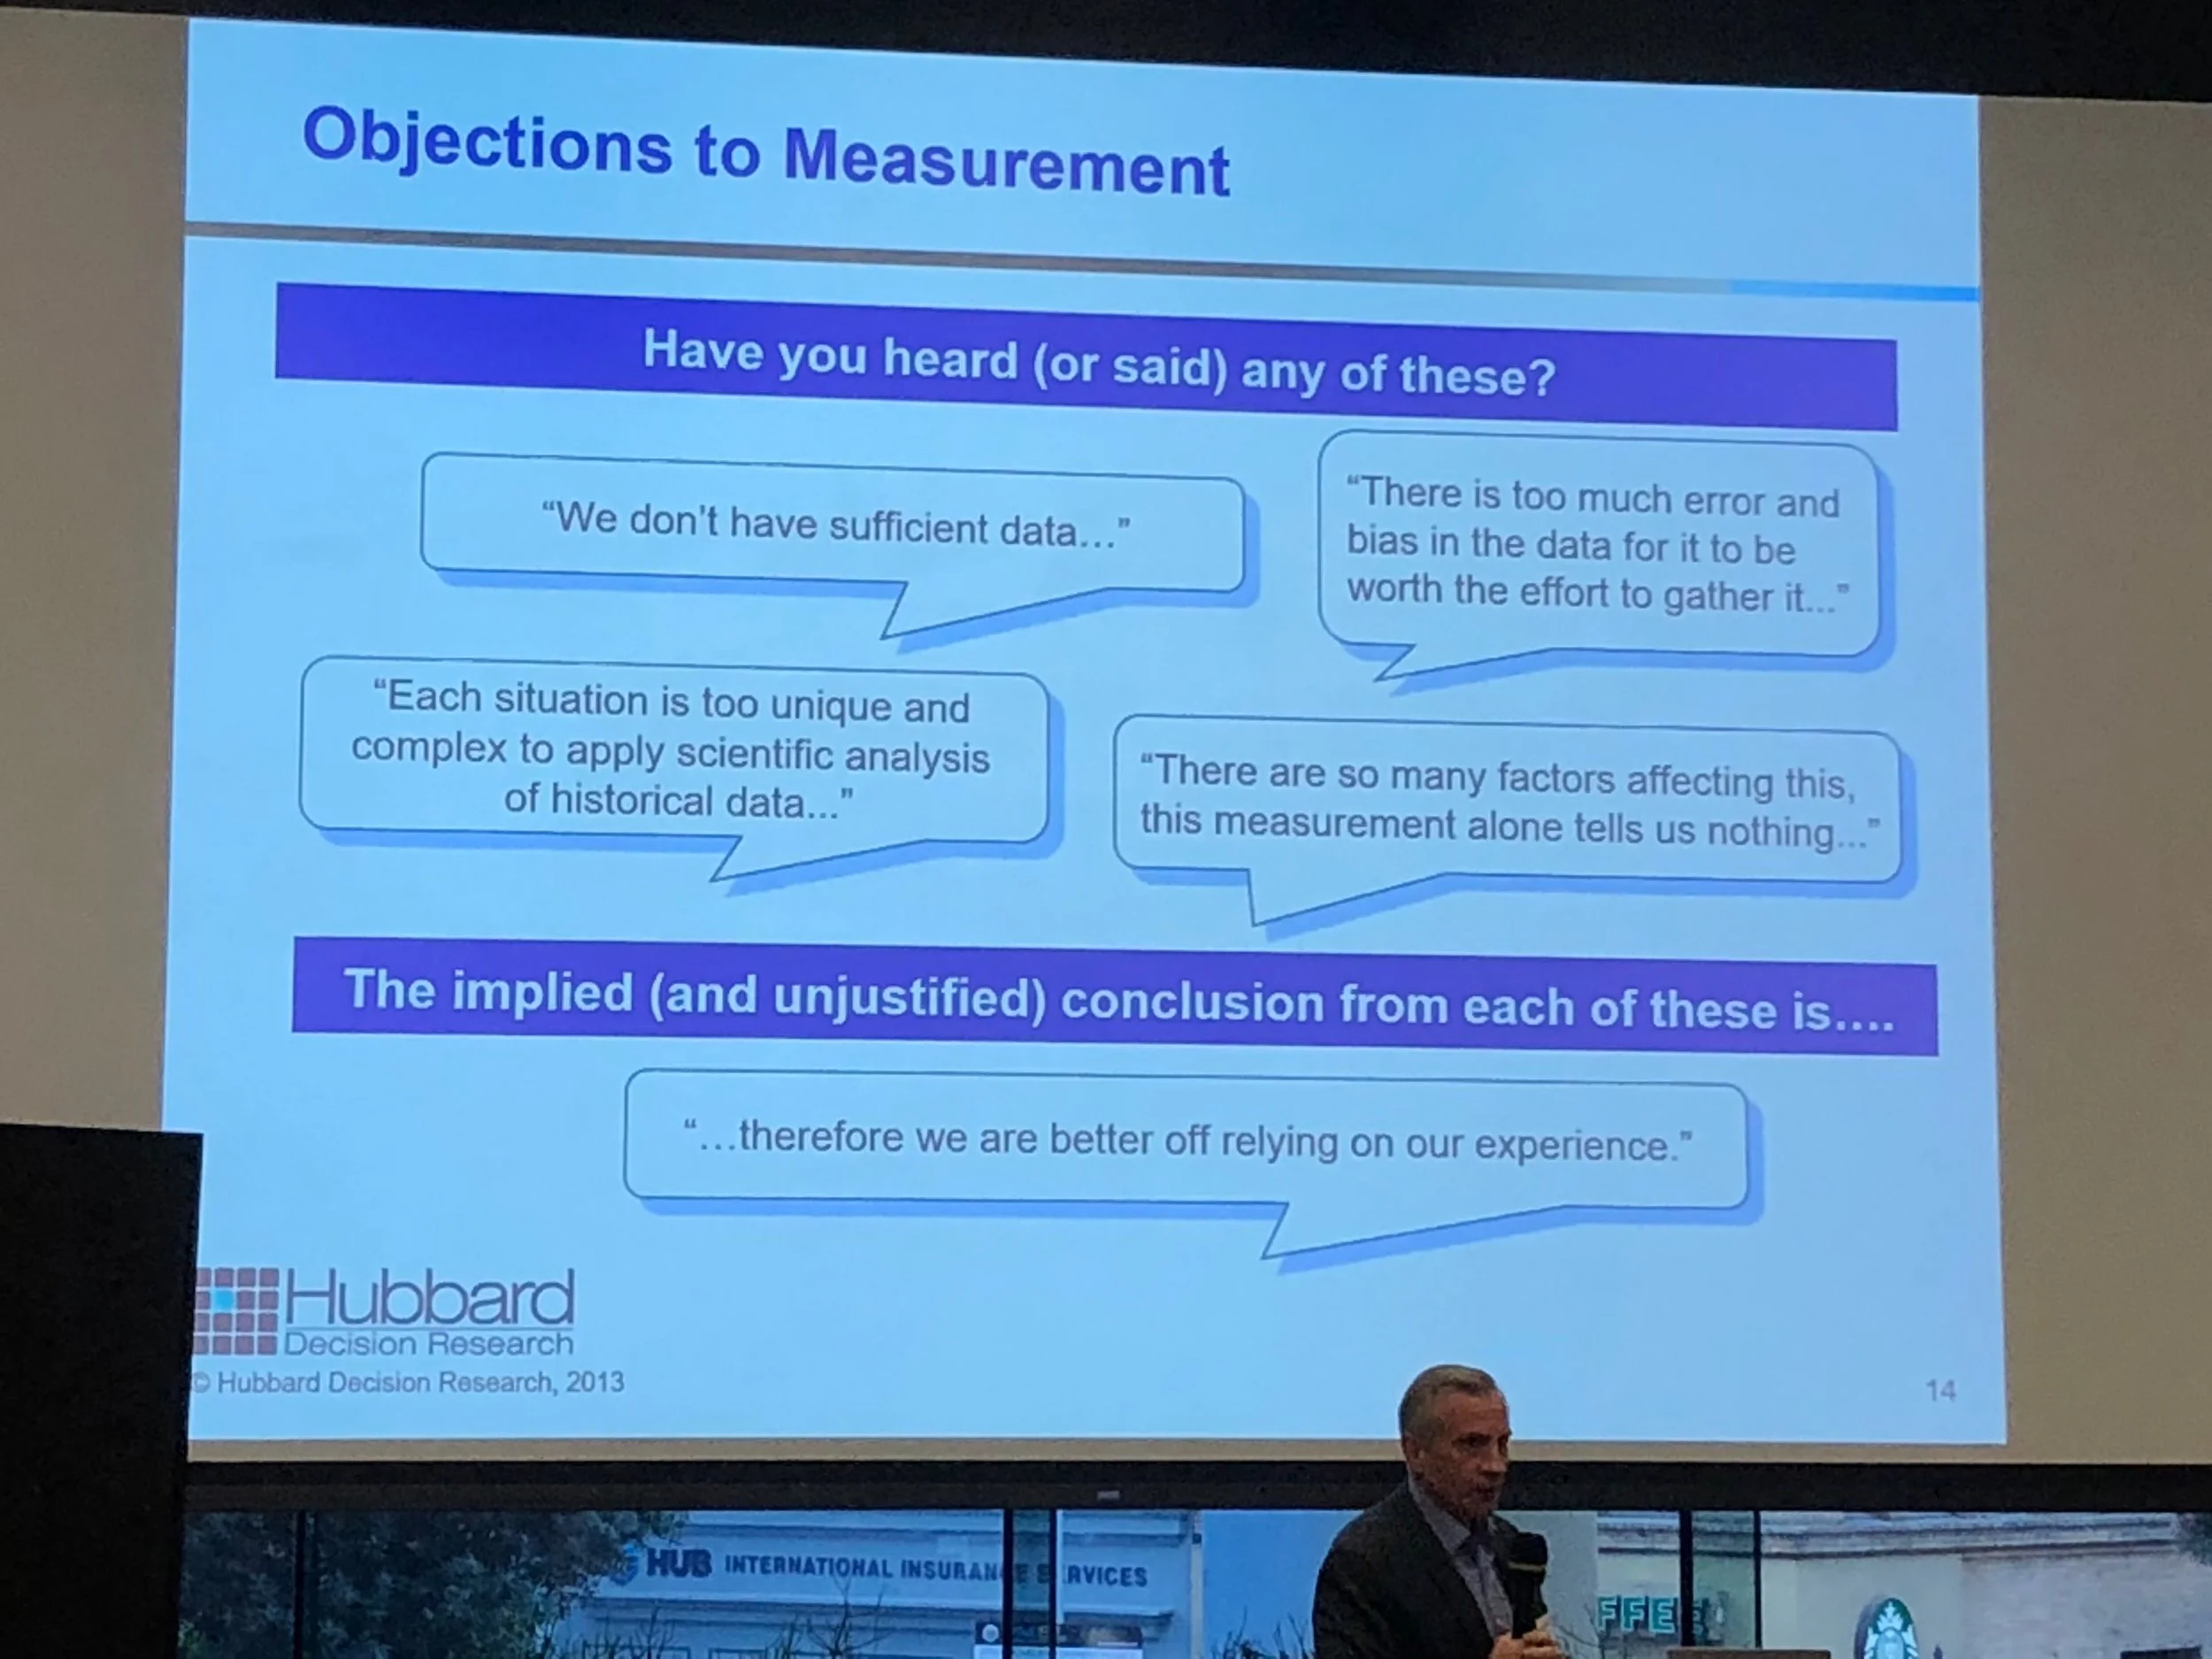
Using adjectives like “red” or “high” in the place of real measurements of risk components (e.g., probability, impact, control strength) are neither precise noraccurate. Even worse, uncertainty is obscured behind the curtain of an adjective feelsexact, but is not. The reader has no idea if this was a precise measurement – using a mixture of historical data, internal data and many calibrated subject matter experts – or if it was made by a guy named Bob sitting in an office, pondering the question for a few seconds and then saying, “That feels High.”
Managing risk is one of the most important things a business can do to stay in business. It’s time to bring uncertainty back to risk measurements. It’s the honest thing to do.

What do paying cyber extortionists and dumping toxic sludge into the Chicago River have in common?
Paying cyber ransoms is like dumping toxic sludge into a public river—cheap in the short term, but costly to society. In this post, I explain how ransomware payments create negative externalities, and why real solutions require changing incentives, not just victim behavior.

What do paying cyber extortionists and dumping toxic sludge into the Chicago River have in common? A lot, actually! Decipher recently interviewed me on some of the research I’ve published and talks I’ve given on ransomware, incentives, negative externalities and how we, the defenders, can influence decisions.
A negative externality is a term used in the field of economics that describes a situation in which a third party incurs a cost from an economic activity. In the case of pollution, it may be convenient or even cost-effective for a firm to dump waste into a public waterway, and while the action is harmful, the firm does not bear the full brunt of the cost. In the case of paying cyber extortionists, it may cost a few Bitcoin to get data back, but that action directly enriches, emboldens and encourages the cybercriminals, thereby creating an environment for more extortion attempts and more victims. We see negative externalities everywhere in society. This condition occurs when there is a misalignment between interests to the individual and interests to society.
City planners in Chicago reversed the flow of the Chicago River to solve the pollution problem, and it worked! A similar solution is needed in the case of cyber extortion, ransomware and malware in general. Focusing on changing victims’ behavior by constantly saying “Don’t ever pay the ransom!” isn’t working. We need to move upstream – further up in the decision tree – to affect real change.
The cover image is a picture taken in 1911 of a man standing on slaughterhouse waste floating on Bubbly Creek, a fork of the Chicago River. Bubbly Creek was described in horrifying detail by Upton Sinclair in The Jungle. The drainage of many meat packing houses flowed into Bubble Creek and was made of sewage, hair, lard and chemicals. It periodically spontaneously combusted into flames and the Chicago Fire Department had to be dispatched regularly to put it out.

How Many Lottery Tickets Should I Buy?
When lottery jackpots are at record highs, as they are this week at $1.6 billion, I’m usually asked by friends, family, and colleagues for the same advice – should I buy a lottery ticket, and if yes, how many should I buy?

When lottery jackpots are at record highs, as they are this week at $1.6 billion, I’m usually asked by friends, family, and colleagues for the same advice – should I buy a lottery ticket, and if yes, how many should I buy?
Being trained in economics and a risk manager by trade, one would expect me to say that lottery tickets are a waste of time, money – or, maybe a rant on how the lottery is a regressive tax on the poor. Not this economist/risk manager. I’ve spent a good deal of time studying odds at craps, horse races, and roulette tables in Vegas and the answer lies in understanding a little bit of probability theory.
First, look at this problem in terms of the expected value of buying a lottery ticket, which is based on the probability of winning and how much you could win. The expected value of the Mega Millions drawing on Tuesday, October 23rd, is $5.53, for a $2 ticket. It’s quite rare for the expected value of a game of chance to exceed the price of entry. Economically speaking, you should play this lottery on Tuesday.
The question remains, – how many tickets?
To answer this question, think of the problem this way: how much money do I need to spend to increase my odds? If you don’t play the lottery, the chance of winning is near-zero*. Buying one $2 ticket increases your odds from near-zero to 1 in 302 million. What a deal! You can increase your odds of winning by such a colossal amount for only $2, and the expected value exceeds the price of a ticket! Here’s the trick – the second, third, tenth, hundredth ticket barely increases your odds over 1 in 302 million. You could buy enough tickets to demonstrably increase your odds, but at that point, you would have to buy so many tickets, the expected value would be below $2.
The answer: one ticket. Just buy one. One is a good balance between risk and reward.
Not coincidentally, knowing how to calculate expected value is a superpower for risk managers when trying to optimize investments and expenditures.
(*Near zero, not zero because it’s possible you can find a winning lottery ticket on the ground, in a jacket at Goodwill, etc. It’s happened.

An Evening with Doug Hubbard: The Failure of Risk Management: Why it's *Still* Broken and How to Fix It
What do dog love, company reputation, and the Challenger explosion have in common? In this recap of Doug Hubbard’s live Measurement Challenge, we explore how even the most “immeasurable” things in risk and life can, in fact, be measured—if we frame them right.

There seems to be two different types of risk managers in the world: those who are perfectly satisfied with the status quo, and those who think current techniques are vague and do more harm than good. Doug Hubbard is firmly in the latter camp. His highly influential and groundbreaking 2009 book titled The Failure of Risk Management: Why it’s Broken and How to Fix It takes readers on a journey through the history of risk, why some methods fail to enable better decision making and – most importantly – how to improve. Since 2009, however, much has happened in the world of forecasting and risk management: the Fukushima Daiichi Nuclear Disaster in 2011, the Deepwater Horizon Offshore Oil Spill in 2019, multiple large data breaches (Equifax, Anthem, Target), and many more. It makes one wonder; in the last 10 years, have we “fixed” risk?
Luckily, we get an answer. A second edition of the book will be released in July 2019, titled The Failure of Risk Management: Why it's *Still* Broken and How to Fix It. On September 10th, 2018, Hubbard treated San Francisco to a preview of the new edition, which includes updated content and his unique analysis on the events of the last decade. Fans of quantitative risk techniques and measurement (yes, we’re out there) also got to play a game that Hubbard calls “The Measurement Challenge,” in which participants attempt to stump him with questions they think are immeasurable.

It was a packed event, with over 200 people from diverse fields and technical backgrounds in attendance in downtown San Francisco. Richard Seiersen, Hubbard’s How to Measure Anything in Cybersecurity Risk co-author, kicked off the evening with a few tales of risk measurement challenges he’s overcome during his many years in the cybersecurity field.
Is it Still Broken?
The first edition of the book used historical examples of failed risk management, including the 2008 credit crisis, the Challenger disaster and natural disasters to demonstrate that the most popular form of risk analysis today (scoring using ordinal scales) is flawed and does not effectively help manage risk. In the 10 years since Hubbard’s first edition was released, quantitative methods, while still not widely adopted, have made inroads in consulting firms and companies around the world. Factor Analysis of Information Risk (FAIR) is an operational risk analysis methodology that shares many of the same approaches and philosophies that Hubbard advocates for and has made signification traction in risk departments in the last decade. One has to ask – is it still broken?
It is. Hubbard pointed to several events since the first edition:
Fukushima Daiichi Nuclear Disaster (2011)
Deepwater Horizon Offshore Oil Spill (2010)
Flint Michigan Water System (2012 to present)
Samsung Galaxy Note 7 (2016)
Amtrak Derailments/collisions (2018)
Multiple large data breaches (Equifax, Anthem, Target)
Risk managers are fighting the good fight in trying to drive better management decisions with risk analysis, but by and large, we are not managing our single greatest risk: how we measure risk.
Hubbard further drove the point home and explained that the most popular method of risk analysis, the risk matrix, is fatally flawed. Research by Cox, Bickel and many others discovered that the risk matrix adds errors, rather than reduces errors, in decision making.
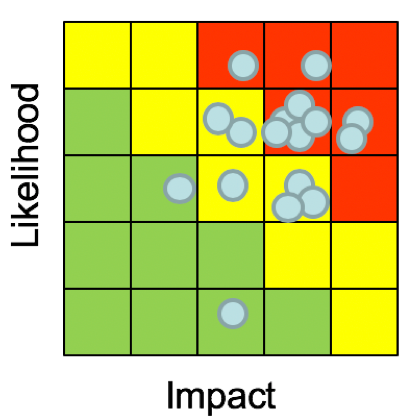
Fig 1: Typical risk matrix
See Fig. 1: “Should we spend $X to reduce risk Y or $A to reduce risk B?” It is not clear how to answer this question, using the risk matrix methodology.
How do we fix it? Hubbard elaborated on the solution at length, but the short answer is: math with probabilities. There are tangible examples in the first edition of the book, and will be expanded upon in the second edition.
The Measurement Challenge!
A pervasive problem in business is the belief that some things, especially those that are intangible, cannot be measured. Doug Hubbard has proven, however, that anything can be measured. The technique lies in understanding exactly what measurement is and framing the object under measurement in a way that facilitates measurement. Based on this idea, Hubbard created a game that he likes to do on his website, books and occasionally when he speaks at an event, called The Measurement Challenge. The Measurement Challenge is a simple concept: Hubbard will take questions, concepts, items, or ideas that people perceive to be immeasurable, and he will demonstrate how to measure them. The Measurement Challenge is based on another one of Hubbard’s books, How to Measure Anything: Finding the Value of Intangibles in Business in which simple statistical techniques are described to demonstrate how to measure (literally!) anything.
When all the participants checked into the event that evening, The Measurement Challenge was briefly explained to them, and they were given paper to write down one item they thought was hard or impossible to measure. Some entries actually have been measured before, such as measuring the number of jelly beans in a jar, the number of alien civilizations in the universe and decomposition problems, similar to the number of piano tuners in Chicago. The most interesting ones were things that are intangible, and which is of course, is Hubbard’s specialty.
Measuring intangibles requires a clear definition of what it is you're trying to measure.
It’s useful to keep in mind the clarification chain, described in Hubbard’s book How to Measure Anything: Finding the Value of Intangibles in Business. The clarification chain is summed up as three axioms:
If it matters at all, it is detectable/observable.
If it is detectable, it can be detected as an amount (or range of possible amounts.)
If it can be detected as a range of possible amounts, it can be measured.
All entries were collected, duplicates were combined and tallied up for final voting. The finalist questions were put up on an online voting system for all participants to vote on from their smartphones. There were a diverse number of excellent questions, but two were picked to give plenty of time to delve into the concepts of measurement and how to decompose the problems.
Some interesting questions that weren’t picked:
Measure the capacity for hate
The effectiveness of various company training programs
The value of being a better calibrated estimator
How much does my daughter love me?
The winning questions were:
How much does my dog love me?, and
What is the probable reputation damage to my company resulting from a cyber incident?
Challenge #1: How much does my dog love me?
How much does my dog love me? This is a challenging question, and it combined many other questions that people had asked of a similar theme. There were many questions on love, hate and other emotions, such as: How do I know my daughter loves me? How much does my spouse love me? How can I measure the love between a married couple? How much does my boss hate me? If you can figure out how to measure love, you would also know how to measure hate. Taking that general theme, “How much does my dog love me?” is a good first measurement challenge.
Hubbard read the question, looked up somewhat quizzically and told the person who had asked the question to raise their hand. He asked a counter question: “What do you mean by love?” Most people in the audience, including the person who’d asked the question, were unsure how to answer. Pausing to let the point be made, Hubbard then started to explain how to solve this problem.
He explained that the concept of “love” has many different definitions based on who you are, your cultural differences, age, gender, and many other factors. The definition of love also varies by the object of which you are forming the question around. For example, the definition of love from an animal is very different from the definition of love from a child, which is also very different from the love from a spouse. After explaining, Hubbard asked again: “What do you mean by love from your dog? What does this mean?”
People started throwing out ideas of what it means for a dog to love an individual, naturally using the clarification chain as a mental framework. Observable, detectable behaviors were shouted out, such as:
When I come home from work and my dog is happy to see me. She jumps up on me. This is how I know she loves me.
I observe love from my dog when he cuddles in bed after a long day at work.
Some dogs are service animals and are trained to save lives or assist throughout your day. That could also be a form of love.
Hubbard asked a follow-up question, “Why do you care if your dog loves you?” This is where the idea of measuring “love” started to come into focus for many of the people in the audience. If one is able to clearly define what love is, able to articulate why one personally cares, and frame the measurement as what can be observed, meaningful measurements can be made.
The last question Hubbard asked was, “What do you already know about this measurement problem?” If one’s idea of love from a dog is welcome greetings, one can measure how many times the dog jumps up, or some other activity that is directly observable. In the service animal example, what would we observe that would tell us that the dog is doing its job? Is it a number of activities per day that that the dog is able to complete successfully? Would it be passing certain training milestones so that you would know that the dog can save your life when it's needed? If your definition of love falls within those parameters, it should be fairly easy to build measurements around what you can observe.
Challenge #2: What is the probable reputation damage to my company resulting from a cyber incident?
The next question was by far one of the most popular questions that was asked. This is a very interesting problem, because some people would consider this to be an open and shut case. Reputation damage has been measured many times by many people and the techniques are fairly common knowledge. However, many risk managers proudly exclaim that reputation damage simply cannot be measured for various reasons: the tools don't exist, it’s too intangible, or that it's not possible to inventory all the various areas a business has reputation, as an asset to lose.
Just like the first question, he asked the person that posed this problem to raise their hand and he asked a series of counter questions, designed to probe exactly what they mean by “reputation,” what could you observe that would tell you that have good reputation, and as a counter question, what could you observe that would tell you that you have a bad reputation?
Framing it in the form of observables started an avalanche of responses from audience. One person chimed in saying that if a company had a good reputation, it would lead to customers’ trust and sales might increase. Another person added that an indicator of a bad reputation could be a sharp decrease in sales. The audience got the point quickly. Many other ideas were brought up:
A drop in stock price, which would be a measurement of shareholder trust/satisfaction.
A bad reputation may lead to high interest rates when borrowing money.
Inability to retain and recruit talent.
Increase in public relations costs.
Many more examples, and even more sector specific examples, were given by the audience. By the end of this exercise, the audience was convinced that reputation could indeed be measured, as well as many other intangibles.
Further Reading
Hubbard previewed his new book at the event and everyone in the audience had a great time trying to stump him with measurement challenges, even if it proved to be futile. These are all skills that can be learned. Check out the links below for further reading.
Douglas Hubbard
The Failure of Risk Management, by Douglas Hubbard
The Failure of Risk Management: Why it’s Broken and How to Fix It | Current, First edition published in 2009
The Failure of Risk Management: Why it's *Still* Broken and How to Fix It | 2nd edition, Due to be released in July, 2019
How to Measure Anything, by Douglas Hubbard
How to Measure Anything: Finding the Value of Intangibles in Business | 3rd edition
How to Measure Anything in Cyber Security Risk | with co-author Richard Seiersen
More Information of Risk Matrices
Bickel et al. “The Risk of Using Risk Matrices”, Society of Petroleum Engineers, 2014
Tony Cox “What’s wrong with Risk Matrices”

The Semi-Attached Figure: How to spot manipulative security advertising claims
Out of all the ways to lie with statistics and manipulate peoples’ perceptions, the semi-attached figure may be the most prevalent. It’s hard to spot unless you are really looking for it because it’s sneaky, subtle and takes a fair bit of concentrative analysis to identify. A semi-attached figure occurs when proof is given for a claim, but when the reader looks at it closely, the proof and the claim are not related. It’s called “semi-attached” because the proof seemsto support a claim, but upon inspection, it doesn't. Marketing and advertising professionals are absolute masters of the semi-attached figure.

If you can't prove what you want to prove, demonstrate something else and pretend that they are the same thing. In the daze that follows the collision of statistics with the human mind, hardly anybody will notice the difference.
-Darrell Huff, “How to Lie with Statistics”
Out of all the ways to lie with statistics and manipulate peoples’ perceptions, the semi-attached figure may be the most prevalent. It’s hard to spot unless you are really looking for it because it’s sneaky, subtle and takes a fair bit of concentrative analysis to identify. A semi-attached figure occurs when proof is given for a claim, but when the reader looks at it closely, the proof and the claim are not related. It’s called “semi-attached” because the proof seemsto support a claim, but upon inspection, it doesn't. Marketing and advertising professionals are absolute masters of the semi-attached figure.
The semi-attached figure is a hard concept to understand without tangible examples, so let’s start out with a few easy marketing claims outside of the security field.
Example 1: Now, with Retsyn!
This example was touched on by David Lavenda in a post at FastCompany. It’s such a familiar advertising campaign that went on for decades, that most of us can recite parts of it from memory. It’s also one of the best examples of the semi-attached figure.

In Certs commercials, the narrator says “Want fresh, clean breath? Get the only mint with Retsyn,” or a similar slogan. Most viewers will hear this and unconsciously accept the “…with Retsyn” phrase as proof that Certs gives someone fresh, clean breath. It soundsgood – it actually sounds great! It sounds like it will make stinky breath less stinky. Here’s where the claim and the proof are semi-attached: you the audience, have bad breath and need evidence as to why you should buy Certs. Here’s the proof – Certs has Retsyn.
What exactly is Retsyn? According to an article by Slate, it’s “…natural flavoring, partially hydrogenated cottonseed oil, and a nutritional supplement called copper gluconate, none of which will kill bacteria.” The proof and the claim have nothing to do with each other, but it’s very effective as a marketing technique.
Example 2: These cigarettes are fine for your health
Post-World War II to the early 1970’s was the golden age of tobacco marketing in the United States before advertising restrictions were put in place. Cigarette advertising downplayed the unhealthy effects of smoking – and in many cases, made the case that it was actually healthy, and cured various maladies even though a strong statistical link between smoking and lung cancer was established in the 1940’s.
People born in the 1980’s and after have probably never seen a cigarette ad or have a vague recollection of one, perhaps forgetting or not knowing how insidiously manipulative tobacco marketing used to be. Due to the overwhelming evidence that started to build in the 1950’s that cigarettes cause serious illnesses and death, advertising had to counteract this message with pushing the "cool factor," downplaying health issues and touting benefits. To convince people to buy cigarettes, contrary to extensive evidence that they should not, marketing had to find new ways to be effective and directly play to human emotion. The semi-attached figure plays a vital role in achieving that.

This 1949 ad from Viceroy Cigarettes is a perfect application of the semi-attached figure. This came out at a time in which public health advocates started discussing the link between smoking and cancer, and this ad is an attempt to counter the message.

The claim here is implied: cigarettes are not harmful to your health. There are two pieces of proof provided: First, Viceroys filter the smoke. (The truth is irrelevant: research indicates filtersmay increase lung cancer risk). The second proof is, your dentist recommends Viceroys, with a cartoon drawing of a dentist. The problem here is obvious. The dentist isn’t real – but the reader is led to think that either this man is their dentist, or whoever really is their dentist would surely also recommend Viceroys.
Example #3: Exactly what is Unbreakable?

The Unbreakable Linux bus at the RSA conference
Starting around 2005, on the 101 freeway corridor between Palo Alto and San Francisco, Oracle advertising started to appear. It featured an armored Linux penguin mascot and the tagline “Unbreakable Linux.” The same ads showed up for years at RSA security conferences, emblazoned on the sides of busses that took trips between the Moscone convention center and area hotels. This claim refers to a product called Oracle Linux, which is based on Red Hat. Oracle has also used the word “unbreakable” to refer to other software products.

This is a classic semi-attached figure – Oracle makes a statement, “unbreakable,” and leads the reader to associate the statement with a piece of software and pretends it’sthe same thing. The claim and proof are taking advantage of the perception that Linux enjoys greater stability when compared to competitors. Of course, the software isn’t “unbreakable” (no software is), and Oracle Linux has been subject to many of the same vulnerabilities all flavors of Linux has had over the years.
Unbreakable. This Linux distro that cannot be… what? Hacked? Experience downtime? Patched without rebooting? Does this refer to high availability? It’s very reminiscent of “with Retsyn.” It sounds great, but when it’s really analyzed, the reader is left thinking, what does that even mean?
Oracle still uses the term “Unbreakable,” but backtracked and admitted that it’s a marketing tagline, describing Oracle’s commitment to product security and does not refer to any specific product, feature or attribute.
Oracle is no stranger to hyperbole. This is the same company who’s marketing slogan used to be “Can’t break it. Can’t break in.”
Example #4: We won the Cyber!
100% true story; only the names have been changed to protect the guilty.
Timeshare, used car and cyber security vendor sales people all have a special place in my heart. I was in a security vendor sales pitch many years back, and the salesman projected this graph of the number of cybersecurity incidents reported by federal agencies from 2006 to 2015 on the screen. The vendor was selling next generation firewall technology.

The room fell silent to the stark reality on the chart before us as the vendor started their pitch:
“Look at this graph – from 2006 to today, cyberattacks have increased over 10-fold! We’re at war. This is proof that we’re at cyberwar and you must protect yourself. The current equipment you have cannot protect your company from these types of unrelenting, sophisticated, advanced AND persistent attacks...”
The salesman went on and on and on. I love stuff like this. I love it when vendors build their pitch around a house of cards: one tap and it all falls apart. Where’s the semi-attached figure here?
The vendor was trying to lead us to a path to believe that the sky is falling. Maybe it is, maybe it isn’t – I have plenty of reason to believe that there is some type of cyber-related doom on the horizon, but this graph has nothing to do with it. In order to find the semi-attached figure, let’s ask a few probing questions.
It would appear that cyberattacks have increased from 2006 to 2015. Why? Are there more computers in 2015 than in 2006?
What is the ratio of attack targets and surface versus attacks?
Is detection of attacks better in 2015 than it was in 2006, meaning we have the ability to detect and measure a larger range of attacks?
What is being measured here?
What does the Federal government consider an attack?
What do attacks against the Federal government have to do with my company (a bank, at the time)

The claim is: we’re going to get hacked unless we upgrade firewalls. The proof is this graph – from a different sector, provided without context, using an unknown method of measurement.
The graph above is from 2015. See 2016’s graph below – and I have great news! WE WON THE CYBER!

No, sorry, we didn’t. The federal government changed the definition and reporting requirements of a cyber-attack in 2016. They no longer consider a simple port scan an attack. In other words, what was being measured and the unit of measurement was changed from 2015 to 2016. Not only was the vendor pitch a semi-attached figure, the salesman was also guilty of the post hoc fallacy, also known as correlation does not imply causation.
How to spot the semi-attached figure
While using the semi-attached figured is manipulative, it’s unlikely to end any time soon. It’s far too effective. Keep in mind that the most effective marketing plays on human nature’s greatest fears and aspirations. Here are a few tips to spot and resist the lure of the semi-attached figure.
Anyone can take a number, graph, data visualization, or statistic and shoehorn it into proof for a claim. Just because something has a number or seems “sciencey” it doesn’t mean it can be automatically trusted.
Spot the claim, such has “this product makes you hacker-proof” or “Unbreakable!” What’s the supporting proof? Ask yourself: does the proof support the claim, or is it semi-attached?
Last, be especially wary of authority figures: doctors, dentists, cybersecurity experts, a CEO or past or present government officials. It could be a legitimate opinion or endorsement, but also remember that nearly everyone will say nearly anything if they get paid enough.
Here’s a challenge for readers: after you read this post, think about the semi-attached figure next time you are at the Blackhat or RSA vendor expo halls. How many do you see?
This post is part of a series titled How to Lie with Statistics, Information Security Edition– visit the link to read more.

The Mad Men of Cyber Security Advertising
The framing effect is used in many places, intentionally and unintentionally, but is most present in advertising. It's a very effective way to frame perceptions.

“We can be blind to the obvious, and we are also blind to our blindness.”
― Daniel Kahneman, Thinking, Fast and Slow
There’s a famous line spoken by advertising executive Don Draper in AMC’s Mad Man: “If you don’t like what’s being said, change the conversation.”
This is a loaded quote and sums up how the ad men of Madison Avenue use words, emotion, a little bit of statistics and a whole lot of creativity to change minds and sell products. Consider this example: American Tobacco, parent company of Lucky Strike Cigarettes, was one of the first companies to use physicians in cigarette ads — a trend that disturbingly lasted until 1953.

There are several psychological sleight of hands tricks, all designed to elicit positive feelings from the reader and de-emphasize any negative ones. The smiling doctor, the phrases “less irritating,” and “It’s toasted” combined with a seemingly large number of endorsing doctors are examples of what is called the framing effect. The framing effect is a cognitive bias that describes a situation in which a person’s perception about something is influenced by the way it’s presented. Who wouldn’t want something that’s both endorsed by doctors and toasted? Psychologists Daniel Kahneman and Amos Tversky explored the framing effect in great detail as they developed Prospect Theory, for which Kahneman would later win the Nobel Prize in Economics.
The framing effect is used in many places, intentionally and unintentionally, but is most present in advertising, as in the positive frame in Lucky Strike ad. It’s a very effective way to frame statistics or concepts to change the audience perception about a marketing claim. Once you’re aware of it, you’ll start to see it everywhere. Take the following Kaspersky infographic as another example of a negative frame:

Source: Kaspersky Security Bulletin 2016
Kaspersky Lab is a Russia-based cybersecurity and anti-virus vendor. The above infographic is in reference to a study the firm conducted that shows that 1 in 5 small and medium sized business that paid a ransom in response to a ransomware infection did not get their files decrypted by the perpetrators.
There are several examples the framing effect in this infographic:
Use of the word “never” immediately frames the perception negatively.
Usage of the statistic “One in five” also creates a negative frame.
Red highlighting of the phrase “never got their data back” shifts the conversation to urgency, needing immediate attention and high risk.
The one, single victim clipart that didn’t get their files back is as big as the combined clipart of the four victims that did get their files back. The data visualization used is disproportionate to the actual data.
Just like the cigarette ad from the 1930’s, the use of graphics and data pull the reader’s perception in a very specific direction. In Kapersky’s case, the direction is very negative. The reader is left with the feeling that paying a ransom in response to ransomware infections is a very bad idea because, you may never get your files back.(…and gee whiz, I sure wish I had some anti-virus software to protect me against this terrible thing…)
The same exact base statistic can be flipped and turned into a positive frame.

Everything about the new infographic is the same, but flipped: “4 out of 5” of something positive as opposed to “1 out of 5” of something negative; flipped clipart, positive colors and words are framed positively.
Let’s take it one step further:

80% seems quite good, and note that 80% is equivalent to 4 of out 5. The extra exclamation points are added to further reinforce the positive frame and add excitement around the statistic.
It should be no surprise to anyone that Kaspersky — a company that sells ransomware mitigation software — uses the framing effect, but they’re not the only one. It’s everywhere, and in fact, there are classes, blogs and instructional videos on how to take advantage of the framing effect specifically as a marketing tool. Overcoming these psychological tricks is not easy because they take advantage of a deep-rooted human trait: loss aversion. But awareness of these marketing tactics is a step forward in improving decision-making skills.
This post is part of a series titled How to Lie with Statistics, Information Security Edition– visit the link to read more.

GDPR, Ragnarok Online and Decision Analysis
What does an old MMORPG have to do with modern data privacy laws? In this post, I use Ragnarok Online’s sudden EU exit to show how GDPR compliance can trigger real-world decisions—and why sometimes, the rational move is to walk away.

Did you ever think you would read about GDPR, risk analysis and a 16-year old MMORPG in the same place? You can stop dreaming, because here it is!
First: GDPR, tl;dr
General Data Protection Regulation(GDPR) is a massive overhaul of privacy on the Internet that applies to all European Union (EU) persons. Any company outside of the EU needs to comply with GDPR if they store personal data of any EU person. On May 25, 2018 GDPR becomes enforceable, and many companies — including US-based companies with data on EU persons — have been making changes to become compliant. (This explains why you have been receiving so many privacy notice updates lately.)
The cost of GDPR compliance is not cheap or easy, and the price of non-compliance can involve hefty fines and litigation. Every company that stores personal data has most likely spent the last two years performing analysis on whether GDPR applies to them, and if so, what the cost of compliance is.
What Happened with Ragnarok Online?
This leads to a story that took the gaming world by surprise: On April 25, 2018, the online gaming company Gravity Interactive announced they are shutting down all games and services in the EU, effective May 25th– the day GDPR takes effect. All EU-based IP-addresses will be blocked. Understandably, there’s an uproar, especially from EU-based players of Ragnarok Online, one of Gravity Interactive’s most popular games. Gravity Interactive has operated EU-based servers for 14 years and to many, the sudden decision to pull out of the market entirely seems unfair and unexpected. It’s understandable that people would be upset. The company has been the subject of much derision over the decision. But clearly there’s more to the story disappointed gamers.
This is an interesting case study because it illustrates several points in the decision-making process:
How a quantitative risk analysis can be used to help with strategic business decisions;
Every sound risk analysis starts with a clearly defined question; and
Avoidance can be an appropriate way to eliminate risk exposure.
Let’s analyse this problem with, first, forming a question that articulates the decision being made, then identifying possible choices, and last, estimating costs for each choice.
The Question
Every company faces strategic decisions. Sound, informed, decision making requires information about benefits and risk exposure. Risk analysis always needs to answer a question, in other words, a decision that someone needs to make. In our case, the decision for Gravity Interactive is whether to invest the time, money and resources to achieve GDPR compliance. GDPR introduces data privacy, security, compliance and legal requirements that are new for most US-based companies, therefore the cost of compliance can be significant. Most companies, US-based or otherwise, spent the last two years performing analyses of GDPR compliance: the cost of complying with the regulations from many perspectives, including technological. Companies can comply with GDPR, ignore GDPR or pull out of the EU market and analysis will help find the best course of action to take.

Decision: should we invest in GDPR compliance?
The Decisions
A company faces three options when deciding whether to invest in GDPR compliance. First, they need to price out the cost of compliance. This can be an upfront cost, as well as ongoing. Compliance involves funding and starting projects to align people, processes and technologies with applicable regulations. The analysis in this area would include a survey of all changes the company needs to make, estimating the cost, and performing a cost-benefit analysis.
The next option is to ignore compliance. This is where risk analyses are most useful to help a company. Ignoring compliance is always an option — and as risky as it may sound, many companies choose to ignore laws and regulations; some unintentionally, some wilfully. This happens more often than most of us should be comfortable with. We typically find out about this when companies are caught, regulators levy penalties and the story is splashed all over the news. At the same time, many companies successfully fly under the regulatory radar for years without being caught. A risk analysis on compliance risk would involve the length of time it would take for regulatory action to take place (if it takes place), what the regulators would force the company to do and, penance projects to achieve compliance.
Lastly, they can choose to withdraw from the market altogether. In the risk management world, we call this risk avoidance.This is the elimination of risk by choosing not to pursue a potentially risk generating activity. In this case, a company can avoid non-compliance risk by exiting the EU market.
The box below contains sample output of these different analyses. I obviously don’t know any of the costs or risk associated with Gravity Interactive’s decision, so I created a sample Company A with example values.

Company A: Projected Costs of GDPR Compliance Options
It’s clear that the company should not ignore compliance. This activity creates significant risk exposure. It’s likely they would have to pay fines, face litigation and be forced to make changes to comply with GDPR anyway.
Based on the two remaining options — comply with GDPR or exit the market, we can perform a cost/benefit analysis of current EU market share, projected EU growth and balance it against the cost of GDPR compliance. Based on my analysis of Company A, it should exit the EU market.
If I were responsible for risk management at either Company A or Gravity Interactive, I would want to perform additional risk analyses on the current state of data privacy and security. If compliance with GDPR is too costly, does the company currently comply with US privacy and security regulations?
In the case of Gravity Interactive, the company clearly decided that forgoing a portion of its customer base, losing the loyalty of its EU fans and risking the ire of gamers worldwide was worth the potential costs of compliance or non-compliance with GDPR. Or in short, to avoid being stuck between Ragnarok and a hard place.

Black Swans in Risk: Myth, Reality and Bad Metaphors
Think you understand Black Swan events? This post dismantles the myth, exposes how risk pros misuse the term, and introduces a better way to frame extreme risk.

The term “Black Swan event” has been part of the risk management lexicon since its coinage in 2007 by Nassim Taleb in his eponymous book titled The Black Swan: The Impact of the Highly Improbable. Taleb uses the metaphor of the black swan to describe extreme outlier events that come as a surprise to the observer, and in hindsight, the observer rationalizes that they should have predicted it.
The metaphor is based on the old European assumption that all swans are white, until black swans were discovered in 1697 in Australia.
Russell Thomas recently spoke at SIRACon 2018 on this very subject in his presentation, “Think You Know Black Swans — Think Again.” In the talk, and associated blog post, Thomas deconstructs the metaphor and Taleb’s argument and expounds on the use and misuse of the term in modern risk management. One of the most illuminating areas of Thomas’ work is his observation that the term “Black Swan” is used in dual ways: both to dismiss probabilistic reasoning and to extend it to describe certain events in risk management that require extra explanation. In other words, Taleb’s definition of Black Swan is a condemnation of probabilistic reasoning, i.e., forecasting future events with some degree of certainty. The more pervasive definition is used to describe certain types of events within risk management, such as loss events commonly found in risk registers and heat maps in boardrooms across the globe. If it seems contradictory and confusing, it is.
From a purely practitioner point of view, it’s worth examining why the term Black Swan is used so often in risk management. It’s not because we’re trying to engage in a philosophical discussion about the unpredictability of tail risks, but rather that risk managers feel the need to separately call out extreme impact events, regardless of probability, because they pose an existential threat to a firm. With this goal in mind, risk managers can now focus on a) understanding why the term is so pervasive, and b) find a way to communicate the same intent without logical fallacies.
Black Swan Definition and Misuse
The most common definition of a Black Swan is: an event in which the probability of occurrence is low, but the impact is high. A contemporary example is a 1,000 year flood or 9/11. In these, and similar events, the impact is so extreme, risk managers have felt the need to classify these events separately; call them out with an asterisk (*) to tell decision makers not to be lulled into a false sense of security because the annualized risk is low. This is where the office-talk term “Black Swan” was born. It is an attempt to assign a special classification to these types of tail risks.
This isn’t an entirely accurate portrayal of Black Swan events, however, according to both Taleb and Thomas.
According to Taleb, a Black Swan event has these three attributes:
First, it is an outlier, as it lies outside the realm of regular expectations, because nothing in the past can convincingly point to its possibility. Second, it carries an extreme ‘impact’. Third, in spite of its outlier status, human nature makes us concoct explanations for its occurrence after the fact, making it explainable and predictable.
After examining the complex scenarios in which these types of conditions exist, it’s clear that the concept Taleb is trying to describe is well beyond something that would be found in a risk register, and is, in fact a critique of modern risk management techniques. It is an oxymoron to include this term in a risk program or even use it to describe risks.
Despite these points, the term has entered the everyday lexicon and, along with Kleenex and Cyber, it’s here to stay. It’s become a generally accepted word to describe low probability, high impact events. Is there something better?
Factor Analysis of Information Risk (FAIR), the risk analysis model developed by Jack Jones, doesn’t deal directly on a philosophical level with Black Swan events, but it does provide risk managers with a few extra tools to describe circumstances around low probability, high impact events. These are called risk conditions.
“Risk Conditions”: The FAIR Way to Treat a Black Swan
Risk is what matters. When scenarios are presented to management, it doesn’t add much to the story if one risk has a higher probability or a lower probability than other types of risks, or if one impact is higher than the other. FAIR provides the taxonomy to assess, analyze and report risks based on a number of factors (e.g. threat capability, control strength, frequency of a loss event). Most risk managers have just minutes with senior executives and will avoid an in-depth discussion of individual factors and will, instead, focus on risk. Why do some risk managers focus on Black Swan events then?
Risk managers use the term because they need to communicate something extra — they need an extra tool to draw attention to those few extreme tail risks that could outright end a company. There may be something that can be done to reduce the impact (e.g. diversification of company resources in preparation for an earthquake) or perhaps nothing can be done (e.g. market or economic conditions that cause company or sector failure). Nevertheless, risk managers would be remiss to not point this out.
Risk conditions go beyond simply calling out low probability, high impact events. They specifically deal with low probability, high impact events that do not have any or have weak mitigating controls. Categorizing it this way makes sense when communicating risk. Extreme tail risks with no mitigating controls may get lost in annualized risk aggregation.
FAIR describes two risk conditions: unstable risk and fragile risk.
Unstable risk conditions describe a situation in which the probability of a loss event is low and there are no mitigating controls in place. It’s up to each organization to define what “low probability” means, but most firms describe events that happen every 100 years or less as low probability. An example of an unstable risk condition would be a DBA having unfettered, unmonitored access to personally identifiable information or a stack of confidential documents sitting in an unlocked room. The annualized loss exposure would probably be relatively low, but controls aren’t in place to lower the loss event frequency.
A fragile risk condition is very similar to an unstable risk condition; however, the distinction is that there is one control in place to reduce the threat event frequency, but no backup control(s). An example of this would be a critical SQL database is being backed up nightly, but there’re no other controls to protect against an availability event (e.g. disk mirroring, database mirroring).
Conclusion
Don’t fight the Black Swan battle — leave that to philosophers and risk thinkers — but try to understand why someone is calling something a Black Swan. Provide the tools, such as those provided by the FAIR taxonomy, to help business leaders and your colleagues conceptualize actual risk. Risk conditions describe these types of events and the unique risks they pose with greater clarity and without outdated, often misused metaphors.
Originally published at www.fairinstitute.org.

Will the Real “Year of the Data Breach” Please Stand Up?
For over a decade, nearly every year has been dubbed the "Year of the Data Breach"—and it’s getting ridiculous. This post breaks down the history, the hype, and why it’s time to retire the phrase once and for all.

My New Year’s Day ritual has been the same for nearly 10 years now: a late breakfast, a cup of strong coffee and a scan of security blogs and news for two things that always make me chuckle: cyber predictions for the new year, and a retrospective that declares the past year the “Year of the Data Breach.” Kelly Shortridge perfectly parodied the former and I actually thought we might go a year without the latter, until I found this headline on Bloomberg news in which 2017 is named the Year of the Data Breach:

Source: Bloomberg;
https://www.bna.com/2017-year-data-b73014473359/
If you are wondering to yourself, where have I seen this before…? It’s nearly every year. 10 of the last 12 years, to be exact.
Here’s a retrospective on the last 12 years and a glimpse into 2018’s prospects.
2005
2005 was the first year ever to be declared “The Year of the Data Breach” by many media outlets, such as InfoWorld. The phrase “data breach” entered into everyday usage in 2005 as well, due to data breach notification laws being enacted, increased data breach litigation as well as Ameritrade, CitiGroup and CardSystems all disclosing incidents.
2006
2006 was a big year for data breaches — it featured the AOL search data leak scandal and the US Department of Veterans Affairs breach. It caused one blogger and one security vendor to dub 2006 the year of the data breach.
2007
Attrition.org, the Identify Theft Resource Center and the Canadian Federal Privacy Commissioner in a letter to Parliament all declared 2007 “the year of the data breach.” I remember 2007 for two things: Britney Spears’ sad meltdown and the TJ Maxx data breach.
2008
Nothing! 2008 is not the year of the data breach! Good job, 2008.
2009
If 2005, 2006 and 2007 were all the year of the data breach, 2009 is the year of the MEGA DATA BREACH, according to Forbes and a security vendor. It was a big one, primarily due to the Heartland Payment Systems data breach which was a compromise of 130 million records.
2010
After the MEGA year of 2009, we all decided to take a break.
2011
After 2008 and 2010 were not the year of the data breach, it was as if security journalists, vendors and cyber experts all stood up and shouted, in unison, “NEVER AGAIN! There shall never be a year that is not the Year of the Data Breach!”
And a good year it was. Trend Micro called it and Brian Krebs, among many others referenced it. The most notable incident was the Sony Playstation Network suffering a prolonged service outage and data breach.
2012
A small security vendor, in a year end retrospective, named 2012 the “Year of the Data Breach,” with breaches at Yahoo, Zappos and several high-profile incidents in the government sector dominating the news. It was also the “Year of the Data Breach in New Zealand,” according to the country’s privacy commissioner.
2013
2009 wants its adjective back. Symantec, in the 2013 Internet Security Threat Report, dubbed 2013 the “Year of the Mega Data Breach,” citing attacks on small and medium-sized businesses and the government sector. Others called it the “Year of the Retailer Breach” due to incidents at Target and Adobe.
2014
Assuming we could only have one “Year of the Data Breach,” 2014 would have to be the strongest contender. There were a massive amount of incidents in 2014: UPS, Michael’s, Home Depot, Jimmy John’s, Staples and JP Morgan Chase. The aforementioned are all eclipsed by, The Hack of the Century (according to Fortune): the Sony Pictures Entertainment hack.
Most media outlets dubbed 2014 the “Year of the Data Breach,” as well as Advisen, Trend Micro and Tripwire’s State of Security.
2015
I declare 2015 the “Year of Superlatives.” Here is how the year was reported:
Fortune reported 2015 as the “Year of Data Breach Litigation.”
Security vendor IDM365 called it the “Year of the Super Mega Breach”
Trend Micro just called it the plain old “Year of the Data Breach.” However, Trend Micro also declared 2014 the Year of the Data Breach.
Vice.com called 2015 the “Year of the Healthcare Breach”
Hacked.com called it the “Year of the Personal Data Breach”
GovTech.com settled on “The Year Data Breaches Became Intimate”
HIPAA Journal called 2015 the “Year of the Mega Healthcare Data Breach”
Many Americans were affected by data breaches in 2015, with the most notable incidents occurring at Ashley Madison, OPM, Anthem and the IRS.
2016
After 2014 and 2015, one would think it would be time to retire the phrase “Year of the…” and think of something else. Nope.
A small law firm specializing in data privacy, SecureWorld, and a radio host named 2016 the “Year of the Data Breach.”
In a completely perplexing statement, Ars Technica recognized 2014 and 2015 as the “Year of the Data Breach” and also issued a challenge:
[I]f pundits don’t label [2016] ‘the year of the data breach’ — like a one-phase Chinese zodiac for the 21st century — they’re not doing their jobs at all.
2017
Bloomberg declared 2017 the “Year of the Data Breach,” citing incidents at Equifax, Yahoo and Uber. Experian also jumped on the bandwagon.
2018: a cyber prediction
Combining my two favorite things: cyber predictions and “year of the data breach” declarations, the non-profit Information Security Forum (ISF) stated that 2018 will be the “year of the data breach.”
Conclusion
Much has been written about consumer data breach fatigue. I have no doubt that breach fatigue is real and headlines like this, year over year, contribute to it. When headlines about cybersecurity cross the line into hyperbole, it’s time to re-think how we present the industry’s most pressing problems to the rest of the world. As it stands now, declaring a year the “year of the data breach” has become virtually meaningless. We know that data breaches are going to occur every year. Perhaps, starting this year, we can pull out the one notable data breach as the “Data Breach of the Year,” instead of naming the whole year the “Year of the Data Breach.”
The Birth of a Ransomware Urban Myth
"Nearly 40% of ransomware victims pay up!" Sounds shocking, right? Turns out… that headline was based on eight people. This post unpacks how bad stats become infosec urban legends—and what that means for decision-making.

Would you be surprised to find that “nearly 40% of ransomware victims pay attackers,” according to a recent article published by DarkReading? I sure was. The number of victims that pay ransomware and the amount paid has been an elusive figure for years now. To date, law enforcement has not collected and published ransomware crime statistics like they have for other forms of criminal activity.
Junk research published by security vendors has always irked me because they use and misuse statistics to spread fear and sell products. Security threats are overblown and solutions are oversimplified, leading to a bevy of problems ranging from the creation of information security urban myths to poor corporate decision making based on faulty assumptions.
Sadly, the DarkReading article and underlying research is no exception. It’s a prime example of what’s wrong with vendor-sponsored research and how the rest of us pick up quotes, circulate and re-tweet without giving it a minute of critical thought. It’s easy to spot — just grab a statistic and follow it down the rabbit hole. Let’s dissect the ransomware payment rate and find out what’s really going on.
DarkReading published this article on April 14th, 2017 with the headline:

If you follow the article to the end, a link to the research is cited, along with the name of the security vendor that performed the research (Trustlook). They have a nice blog post and a cute, entertaining infographic — great reading material to send to the CISO tomorrow morning. The next step is to check the validly of the research and see exactly what Trustlook is claiming.
Trustlook is a security vendor and sells a suite of products that protects end-users from malware, including ransomware, and other forms of attack.
The research is based on a survey. Surveys are polls; you ask a group of people a question and record the answers.
Trustlook surveyed 210 of their Mobile Security product customers. Mobile Security is an Android-based anti-virus app.
Trustlook did not disclose a margin of error, which would indicate the survey is not statistically significant. This means the results only apply to the survey takers themselves and cannot be extrapolated to apply to a larger group or the general population.
This would be enough to make anyone that took a semester of college Stats roll their eyes and move on. However, the assertions in the infographic really take the cake. When percentages are used in statistics, the reader tends to forget or lose sight of the underlying numbers. Breaking down the percentages further:
We know 210 customers were surveyed (Trustlook disclosed this).
Of the 210, 45% have never heard of ransomware. Put another way, 94 out of 210 customers answered a survey about ransomware, but have never heard of ransomware. Trustlook conducted research and published a survey on ransomware in which nearly half of the respondents don’t know what ransomware is.

116 respondents had the wherewithal to understand the subject matter for a survey they are filling out.
Of the 116, 20 people had, at some point, been infected with ransomware.
Of the 20 that have been infected, 8 of them paid the ransom.
Let me say that again in case you missed it.
Trustlook found 8 of their customers that said they paid a ransom and turned it into this:

…and DarkReading expanded the claim to include all ransomware victims:

Two days later, it’s everywhere:

Source: Google.com search
A new ransomware urban myth is born.

Selection Bias and Information Security Surveys
Everyone in infosec has seen a sketchy stat—“60% of orgs were hit by ransomware!” But who actually took that survey? This post breaks down how selection bias warps vendor reports and how bad data becomes cybersecurity “truth.”

The auditor stared at me blankly. The gaze turned into a gape and lasted long enough to make me shift uncomfortably in my chair, click my pen and look away before I looked back at him.
The blank look flashed to anger.
“Of course, malicious insiders are the biggest threat to this company. They’re the biggest threat to ALL companies.”
He waved the latest copy of a vendor report, which would lead anyone to believe malicious insiders are the single biggest threat to American business since Emma Goldman.
The report he waved in the room was not research at all. It was vendor marketing, thinly disguised as a “survey of Information Security leaders.” It was solely based on an unscientific survey of a small group of people. It reeked of error and bias.
Selection bias is what makes these surveys virtually worthless. I previously wrote about the problems of surveys in information security vendor reports and I want to dig in deeper on a topic from the last post: properly selecting a representative sample from the general population being surveyed. This matters so much. This is perhaps the most important step when conducting a statistically sound survey.
Why this matters
Risk analysts are one of many professions that rely on both internal and external incident data to assess risk. If a risk analyst is performing an assessment of current or former employees stealing customer data, there are two primary places one would look for incident data to determine frequency: internal incident reports and external data on frequency of occurrence.
One of the first places a risk analyst would look would be one of the many published reports on insider threat. The analyst would then find one or several statistics about the frequency of current or former employees stealing data, and use the figure to help provide a likelihood of a loss event.
If the survey is statistically sound, the results can be extrapolated to the general population. In other words, if the survey states that 12% of insiders use USB devices to steal data, within a margin of error, you can use that same range to help inform your assessment.
If the survey is not statistically sound, the results only apply to respondents of the survey. This is called selection bias.
What is selection bias?
There are many forms of bias that are found in statistics, and by extension, in surveys, but the most common is selection bias. It’s the easiest to get wrong and throws the results off the quickest.
Selection bias occurs when the survey result is systematically different from the population that is being studied. Here are a few ways this happens.
Undercoverage: Underrepresentation of certain groups in the sample. For example, if you are surveying information security professionals, you will want pen testers, risk analysts, department heads, CISO’s — essentially a cross-section. If you have a hard time getting CISO’s to answer the survey, the survey will be biased toward undercoverage of CISO’s.
Voluntary Response: This occurs when your survey takers are self-selected. The most common example of this is online surveys or polls. Slashdot polls are fun — but completely non-scientific because of voluntary response. Optimally, one would like to have participants randomly selected to ensure a good cross-section of groups of people.
Participation bias: This occurs when a certain group of participants are more or less likely to participate than others. This can happen when a certain group appreciates the value of surveys more than others (risk analysts versus pen testers) or if survey takers are incentivized, such as with reward points or cash. Compensating survey takers is a very contentious practice and will usually result in people taking the survey that are not in the intended sample population.
Real-world example
There are many to choose from, but I found the “2015 Vormetric Insider Threat Report” from a random Google search. The report is aesthetically polished and, on the surface, very informative. It has the intended effect of making any reader nervous about data theft from employees and contractors.
The report is based on a survey of 818 IT professionals that completed an online survey. The report authors are very careful; they frame the report as opinion of the respondents. Furthermore, there is a short disclosure at the end of the report that states the survey methodology, identifies the company that performed the survey (Harris Poll) and states that the “…online survey is not based on a probability sample and therefore no estimate of theoretical sampling error can be calculated.”
Let me translate that: This report is for marketing and entertainment purposes only.

Why not?
Here’s another problem: Harris Poll compensates their survey takers. Survey takers earn points (called “HIpoints”) for every survey they fill out. These points can be redeemed for gift cards and other items. We already know the survey isn’t statistically significant from the disclosure, but one must ask — can the survey be trusted to include only IT professionals, if the respondents are self-selected and are rewarded if they say anything to qualify for the survey?
The most obvious problem here is voluntary selection and participation bias; both lead to a situation in which you should not use the survey results to base any serious decision on.
I don’t mean to pick on Vormetric exclusively. There are hundreds of similar surveys out there.
Here’s another one. The Cyberthreat Defense Group conducted an online survey that asked many enterprise security questions. One of the results was that 60% of the respondent’s organizations were hit by ransomware in 2016. I fast-forwarded to the section that described the methodology. They vaguely disclosed the fact that survey takers were PAID and the survey results represented the opinions of the respondents. It’s back-page news, but at least it’s there. This is the problem:
Now it’s not the opinion of a small, self-selected, compensated group of people that may or may not be in security. Now it’s fact.
Then it gets tweeted, re-tweeted, liked, whatever. Now it’s InfoSec Folklore.

See the problem?

The Problem with Security Vendor Reports
Most vendor security reports are just glossy marketing in disguise, riddled with bad stats and survey bias. This post breaks down how to spot junk research before it ends up in your board slides — and how to demand better.

The information security vendor space is flooded with research: annual reports, white papers, marketing publications — the list goes on and on. This research is subsequently handed to marketing folks (and engineers who are really marketers) where they fan out to security conferences across the world, standing in booths quoting statistics and attending pay-to-play speaking slots, convincing executives to buy their security products.
There’s a truth, however, that the security vendors know but most security practitioners and decision makers aren’t quite wise to yet. Much of the research vendors present in reports and marking brochures isn’t rooted in any defensible, scientific method. It’s an intentional appeal to fear, designed to create enough self-doubt to make you buy their solution.
This is how it’s being done:
Most vendor reports are based on surveys, also known as polls
Most of the surveys presented by security vendors ignore the science behind surveys, which is based on statistics and mathematics
Instead of using statistically significant survey methods, many reports use dubious approaches designed to lead the reader down a predetermined path
This isn’t exactly new. Advertisers have consumer manipulation down to an art form and have been doing it for decades. Security vendors, however, should be held to a higher standard due to fact that the whole field is based on trust and credibility. Many vendor reports are presented as security research and not advertisements.
What’s a survey?

A survey is a poll. Pollsters ask a small group of people a question, such as “In the last year, how many of your security incidents have been caused by insiders?” The results are extrapolated to apply it to a general population. For example, IBM conducted a survey that found that 59% of CISO’s experienced cyber incidents in which the attackers could defeat their defenses. The company that conducted the survey didn’t poll all CISO’s — they polled a sample of CISO’s and extrapolated a generality about the entire population of CISO’s.
This type of sampling and extrapolation is completely acceptable to do, if the survey adheres to established methodologies in survey science. Doing so makes the survey statistically significant; not doing it puts the validity of the results in question.
All surveys have some sort of error and bias. However, a good survey will attempt to control for this by doing the following:
Use established survey science methods to reduce the errors and bias
Disclose the errors and bias to the readers
Disclose the methodology used to conduce the survey
A good survey will also publish the raw data for peer review
Why you should care about statistically sound surveys
Surveys are everywhere in security. They are found in cute infographics, annual reports, journal articles and academic papers. Security professionals take these reports and read them, learn from them, quote them in steering committee meetings or to senior executives when they ask questions. Managers often ask security analysts to quantify risk with data — the easiest way is to find a related survey. We rely on the data to enable our firms to make risk-aware business decisions.
When you tell your Board of Directors that 43% of all data breaches are caused by internal actors, you’d better be right. The data you are using must be statistically significant and rooted in fact. If you are quoting vendor FUD or some marking brochure that’s disconnected from reality, your credibility is at stake. We are trusted advisors and everything we say must be defensible.
What makes a good survey
Everyone has seen a survey. Election and public opinion polls seem simple on the surface, but it’s very hard to do correctly. The science behind surveys are rooted in math and statistics; when the survey is, it’s statistically significant.
There are four main components of a statistically significant survey:
Population
This is a critical first step. What is the group that is being studied? How big is the group? An example would be “CISO’s” or “Information Security decision makers.”
Sample size
The size of the group you are surveying. It’s usually not possible to study an entire population, so a sample is chosen. A good survey taker will do all they can to ensure the sample size is as representative as the general population as possible. More importantly, the sample size needs to be randomly selected.
Confidence interval
Also known as the margin of error; (e.g. +/-); larger the sample size, the lower the margin of error.
Unbiased Questions
The questions themselves are crafted by a neutral professional trained in survey science. Otherwise, it is very easy to craft biased questions that lead the responder to answer in a certain way.
What makes a bad survey?
A survey will lose credibility as it uses less and less of the above components. There are many ways a survey could be bad, but here are the biggest red flags:
No disclosure of polling methodology
No disclosure of the company that conducted the poll
The polling methodology is disclosed, but no effort was made to make it random or representative of the population (online polls have this problem)
Survey takers are compensated (people will say anything for money)
Margin of error not stated
Be Skeptical
Be skeptical of vendor claims. Check for yourself and read the fine print. When you stroll the vendor halls at RSA or Blackhat and a vendor makes some outrageous claim about an imminent threat, dig deeper. Ask hard questions. We can slowly turn the ship away from FUD and closer to fact and evidence-based research.
And if you’re a vendor — think about using reputable research firms to perform your surveys.

Prioritizing Patches: A Risk-Based Approach
It’s been a tough few weeks for those of us that are responsible for patching vulnerabilities in the companies we work at. Not only do we have the usual operating system and application patches, we also have patches for VENOM and Logjam to contend with. The two aforementioned vulnerabilities are pretty serious and deserve extra attention. But, where to start and what to do first? Whether you have hundreds or thousands or hundreds of thousands of systems to patch, you have to start somewhere. Do you test and deploy patches for high severity vulnerabilities first, or do you continue to deploy routine patches, prioritizing systems critical to the functioning of your business?

It’s been a tough few weeks for those of us that are responsible for patching vulnerabilities in the companies we work at. Not only do we have the usual operating system and application patches, we also have patches for VENOM and Logjam to contend with. The two aforementioned vulnerabilities are pretty serious and deserve extra attention. But, where to start and what to do first? Whether you have hundreds or thousands or hundreds of thousands of systems to patch, you have to start somewhere. Do you test and deploy patches for high severity vulnerabilities first, or do you continue to deploy routine patches, prioritizing systems critical to the functioning of your business?
It depends. You have to take a risk-based approach to patching, fully considering several factors including where the system is on the network, the type of data it has, what it’s function is and whether or not the patch in question poses a threat.
There’s an old adage in risk management (and business in general): “When everything’s a priority, nothing a priority.” How true it is. For example, if you scan your entire network for the Heartbleed vulnerability, the tool will return a list of all systems that the vulnerability has been found on. Depending on the size of your network, this could seem like an insurmountable task — everything is high risk.
A good habit to get into for all security professionals is to take a risk-based approach when you need to make a decision about resources. (“Resources” in this context can be money, personnel, time, re-tasking an application, etc.) Ask yourself the following questions:
What is the asset I’m protecting? What is the value?
Are there are compliance, regulatory or legal requirements around this system. For example, does it store PHI (Personal Health Information), is in-scope for Sarbanes-Oxley or does it fall under PCI?
What are the vulnerabilities on this system?
What is the threat? Remember, you can have vulnerability without a threat — think of a house that does not have a tornado shelter. The house is in California.
What is the impact to the company if a threat exploited the vulnerability and acted against the asset? Impact can take many forms, including loss productivity, lost sales, a data breach, system downtime, fines, judgments and reputational harm.
A Tale of Two Systems
Take at look at the diagram below. It illustrates two systems with the same web vulnerability, but different use cases and impact. A simple vulnerability scan would flag both systems as having high-severity vulnerabilities, but a risk-based approach to vulnerability mitigation reveals much different priorities.

This is not to say that Server #2 could not be exploited. It very much could be, by an insider, a vendor or from an outside attacker and the issue needs to be remediated. However, it is much more probable that System #1 will be compromised in a shorter time-frame. Server #2 would also be on the list to get patched, but considering that attackers external to the organization have to try a little harder to exploit this type of vulnerability and the server is not critical to the functioning to the business, the mitigation priority is Server #1.
Your Secret Weapon
Most medium-to-large companies have a separate department dedicated to Business Continuity. Sometimes they are in IT as part of Disaster Recovery, and sometimes they are in a completely separate department, focusing on enterprise resiliency. Either way, one of the core functions of these departments is to perform a business impact analysis on critical business functions. For example, the core business functions of the Accounting department are analyzed. Continuity requirements are identified along with impact to the company. Many factors are considered, including financial, revenue stream, employee and legal/regulatory impact.
This is an excellent place to start if you need data on categorizing and prioritizing your systems. In some cases, the business impact analysis is mapped back to actual server names or application platforms, but even if it’s not, you can start using this data to improve your vulnerability management program.
It’s difficult to decide where to deploy scarce resources. The steps outlined above truly are the tip of the iceberg but are nonetheless a great first step in helping to prioritize when and where to start implementing mitigating controls. The most successful Information Security departments are those that able to think in risk-based terms naturally when evaluating control implementation. With practice, it becomes second nature.
About the Author:Tony Martin-Vegue works for a large global retailer leading the firm’s cyber-crime program. His enterprise risk and security analyses are informed by his 20 years of technical expertise in areas such as network operations, cryptography and system administration. Tony holds a Bachelor of Science in Business Economics from the University of San Francisco and holds many certifications including CISSP, CISM and CEH.
Originally published at www.tripwire.com on May 31, 2015.

What’s the difference between a vulnerability scan, penetration test and a risk analysis?
Think vulnerability scan, pen test, and risk analysis are the same thing? They're not — and mixing them up could waste your money and leave you exposed. This post breaks down the real differences so you can make smarter, more secure decisions.

You’ve just deployed an ecommerce site for your small business or developed the next hot iPhone MMORGP. Now what?
Don’t get hacked!
An often overlooked, but very important process in the development of any Internet-facing service is testing it for vulnerabilities, knowing if those vulnerabilities are actually exploitable in your particular environment and, lastly, knowing what the risks of those vulnerabilities are to your firm or product launch. These three different processes are known as a vulnerability assessment, penetration test and a risk analysis. Knowing the difference is critical when hiring an outside firm to test the security of your infrastructure or a particular component of your network.
Let’s examine the differences in depth and see how they complement each other.
Vulnerability assessment
Vulnerability assessments are most often confused with penetration tests and often used interchangeably, but they are worlds apart.
Vulnerability assessments are performed by using an off-the-shelf software package, such as Nessus or OpenVas to scan an IP address or range of IP addresses for known vulnerabilities. For example, the software has signatures for the Heartbleed bug or missing Apache web server patches and will alert if found. The software then produces a report that lists out found vulnerabilities and (depending on the software and options selected) will give an indication of the severity of the vulnerability and basic remediation steps.
It’s important to keep in mind that these scanners use a list of known vulnerabilities, meaning they are already known to the security community, hackers and the software vendors. There are vulnerabilities that are unknown to the public at large and these scanners will not find them.
Penetration test
Many “professional penetration testers” will actually just run a vulnerability scan, package up the report in a nice, pretty bow and call it a day. Nope — this is only a first step in a penetration test. A good penetration tester takes the output of a network scan or a vulnerability assessment and takes it to 11 — they probe an open port and see what can be exploited.
For example, let’s say a website is vulnerable to Heartbleed. Many websites still are. It’s one thing to run a scan and say “you are vulnerable to Heartbleed” and a completely different thing to exploit the bug and discover the depth of the problem and find out exactly what type of information could be revealed if it was exploited. This is the main difference — the website or service is actually being penetrated, just like a hacker would do.
Similar to a vulnerability scan, the results are usually ranked by severity and exploitability with remediation steps provided.
Penetration tests can be performed using automated tools, such as Metasploit, but veteran testers will write their own exploits from scratch.
Risk analysis
A risk analysis is often confused with the previous two terms, but it is also a very different animal. A risk analysis doesn’t require any scanning tools or applications — it’s a discipline that analyzes a specific vulnerability (such as a line item from a penetration test) and attempts to ascertain the risk — including financial, reputational, business continuity, regulatory and others — to the company if the vulnerability were to be exploited.
Many factors are considered when performing a risk analysis: asset, vulnerability, threat and impact to the company. An example of this would be an analyst trying to find the risk to the company of a server that is vulnerable to Heartbleed.
The analyst would first look at the vulnerable server, where it is on the network infrastructure and the type of data it stores. A server sitting on an internal network without outside connectivity, storing no data but vulnerable to Heartbleed has a much different risk posture than a customer-facing web server that stores credit card data and is also vulnerable to Heartbleed. A vulnerability scan does not make these distinctions. Next, the analyst examines threats that are likely to exploit the vulnerability, such as organized crime or insiders, and builds a profile of capabilities, motivations and objectives. Last, the impact to the company is ascertained — specifically, what bad thing would happen to the firm if an organized crime ring exploited Heartbleed and acquired cardholder data?
A risk analysis, when completed, will have a final risk rating with mitigating controls that can further reduce the risk. Business managers can then take the risk statement and mitigating controls and decide whether or not to implement them.
The three different concepts explained here are not exclusive of each other, but rather complement each other. In many information security programs, vulnerability assessments are the first step — they are used to perform wide sweeps of a network to find missing patches or misconfigured software. From there, one can either perform a penetration test to see how exploitable the vulnerability is or a risk analysis to ascertain the cost/benefit of fixing the vulnerability. Of course, you don’t need either to perform a risk analysis. Risk can be determined anywhere a threat and an asset is present. It can be data center in a hurricane zone or confidential papers sitting in a wastebasket.
It’s important to know the difference — each are significant in their own way and have vastly different purposes and outcomes. Make sure any company you hire to perform these services also knows the difference.
Originally published at www.csoonline.com on May 13, 2015.

Not all data breaches are created equal — do you know the difference?
Not all data breaches are created equal — the impact depends on what gets stolen. From credit cards to corporate secrets, this post breaks down the real differences between breach types and why some are much worse than others.

It was one of those typical, cold February winter days in Indianapolis earlier this year. Kids woke up hoping for a snow day and old men groaned as they scraped ice off their windshields and shoveled the driveway. Those were the lucky ones, because around that same time, executives at Anthem were pulling another all-nighter, trying to wrap their heads around their latest data breach of 37.5 million records and figuring out what to do next. And, what do they do next? This was bad — very bad — and one wonders if one or more of the frenzied executives thought to him of herself, or even aloud, “At least we’re not Sony.”
Why is that? 37.5 million records sure is a lot. A large-scale data breach can be devastating to a company. Expenses associated with incident response, forensics, loss of productivity, credit reporting, and customer defection add up swiftly on top of intangible costs, such as reputation harm and loss of shareholder confidence. However, not every data breach is the same and much of this has to do with the type of data that is stolen.
Let’s take a look at the three most common data types that cyber criminals often target. Remember that almost any conceivable type of data can be stolen, but if it doesn’t have value, it will often be discarded. Cyber criminals are modern day bank robbers. They go where the money is.
Common data classifications and examples
Customer financial data
This category is the most profuse and widespread in terms of the number of records breached, and mostly includes credit card numbers, expiration dates, cardholder names, and other similar data. Cyber criminals generally pillage this information from retailers in bulk by utilizing malware specifically written to copy the credit card number at the point-of-sale system when a customer swipes his or her card. This is the type of attack that was used against Target, Home Depot, Neiman-Marcus and many others, and incidents such as these have dominated the news for the last several years. Banks have also been attacked for information on customers.
When cyber criminals then attempt to sell this pilfered information on the black market, they are in a race against time — they need to close the deal as quickly as possible so the buyer is able to use it before the card is deactivated by the issuing bank. A common method of laundering funds is to use the stolen cards to purchase gift cards or pre-paid credit cards, which can then be redeemed for cash, sold, or spent on goods and services. Cardholder data is typically peddled in bulk and can go for as little as $1 per number.
Companies typically incur costs associated with response, outside firms’ forensic analysis, and credit reporting for customers, but so far, a large-scale customer defection or massive loss of confidence by shareholders has not been observed. However, Target did fire its CEO after the breach, so internal shake-ups are always a stark possibility.
Personally identifiable information
Personally Identifiable Information, also known as PII, is a more serious form of data breach, as those affected are impacted far beyond the scope of a replaceable credit card. PII is information that identifies an individual, such as name, address, date of birth, driver’s license number, or Social Security number, and is exactly what cyber criminals need to commit identity theft. Lines of credit can be opened, tax refunds redirected, Social Security claims filed — essentially, the possibilities of criminal activities are endless, much like the headache of the one whose information has been breached.
Unlike credit cards, which can be deactivated and the customer reimbursed, one’s identity cannot be changed or begun anew. When a fraudster gets a hold of PII, the unlucky soul whose identity was stolen will often struggle for years with the repercussions, from arguing with credit reporting agencies to convincing bill collectors that they did not open lines of credit accounts.
Because of the long-lasting value of PII, it sells for a much higher price on the black market — up to $15 per record. This is most often seen when companies storing a large volume of customer records experience a data breach, such as a healthcare insurer. This is much worse for susceptible consumers than a run-of-the-mill cardholder data breach, because of the threat of identity theft, which is more difficult to mitigate than credit card theft.
Company impact is also very high, but is still on par with a cardholder data breach in that a company experiences costs in response, credit monitoring, etc.; however, large-scale customer defection still has not been observed as a side effect. It’s important to note that government fines may be associated with this type of data breach, owing to the sensitive nature of the information.
Internal company information
This type of breach has often taken a backseat to the above-mentioned types, as it does not involve a customer’s personal details, but rather internal company information, such as emails, financial records, and intellectual property. The media focused on the Target and Home Depot hacks, for which the loss was considerable in terms of customer impact, but internal company leaks are perhaps the most damaging of all, as far as corporate impact.
The Sony Pictures Entertainment data breach eclipsed in magnitude anything that has occurred in the retail sector. SPE’s movie-going customers were not significantly impacted (unless you count having to wait a while longer to see ”The Interview” — reviews of the movie suggest the hackers did the public a favor); the damage was mostly internal. PII of employees was released, which could lead to identity theft, but the bulk of the damage occurred due to leaked emails and intellectual property. The emails themselves were embarrassing and clearly were never meant to see the light of day, but unreleased movies, scripts and budgets were also leaked and generously shared on the Internet.
Many firms emphasize data types that are regulated (e.g. cardholder data, health records, company financials) when measuring the impact of a data breach, but loss of intellectual property cannot be overlooked. Examine what could be considered “secret sauce” for different types of companies. An investment firm may have a stock portfolio for its clients that outperforms its competitors. A car company may have a unique design to improve fuel efficiency. A pharmaceutical company’s clinical trial results can break a company if disclosed prematurely.
Although it’s not thought of as a “firm” and not usually considered when discussing fissures in security, when the National Security Agency’s most secret files were leaked by flagrant whistleblower Edward Snowden, the U.S. government experienced a very significant data breach. Some would argue it is history’s worst of its kind, when considering the ongoing impact on the NSA’s secretive operations.
Now what?
Whenever I am asked to analyze a data breach or respond to a data breach, I am almost always asked, “How bad is it?” The short answer: it depends.
It depends on the type of data that was breached and how much of it. Many states do not require notification of a data breach of customer records unless it meets a certain threshold (usually 500). A company can suffer a massive system intrusion that affects the bottom line, but if the data is not regulated (e.g. HIPAA, GLBA) or doesn’t trigger a mandatory notification as required by law, the public probably won’t know about it.
Take a look at your firm’s data classification policy, incident response and risk assessments. A risk-based approach to the aforementioned is a given, but be sure you are including all data types and the wide range of threats and consequences.
Originally published at www.csoonline.com on March 17, 2015.

The Sony Pictures Entertainment hack: lessons for business leaders
A look back at the 2014 Sony hack and what it revealed about enterprise resiliency, defense in depth, and the limits of traditional “good enough” security. Still one of the clearest case studies in modern risk mismanagement.

The November 2014 hack against Sony Pictures Entertainment reads like something straight out of a low-budget movie: employees walk into work one morning to see red skulls appear on their computer monitors, with threats of destruction unless certain demands are met. Move the clock forward several months and while Sony is still picking up the pieces, the security community is trying to figure out if this is just another data breach or a watershed moment in the cat-and-mouse game that defines this line of work.
Plenty of retrospection has occurred, both inside Sony and out, and (rightly so) the conversation has centered on what could have been done differently to prevent, detect and respond to this unprecedented hack. What some people think of as a problem that is limited to cyber-security is actually a problem that spans all aspects of a business.
What lessons can business leaders, outside of the field of cyber-security, learn from the hack?
Enterprise Resiliency
On Monday, November 24th the hacking group, Guardians of Peace or GOP, made the attack known to both Sony and to the public at the same time. Sony management made the decision to shut down computer systems: file servers, email, Internet access, access for remote employees — all computing equipment. Under the circumstances, shutting down a global company was a bold, but necessary, thing to do. The depth and scope of the breach wasn’t completely known at the time and those in charge felt it was important to stop the bleeding and prevent further damage from occurring.
Sony systems were down for over six days. In that time, employees used other methods to communicate with each other, such as text messaging and personal email; in other words, they reverted to manual workarounds. Manual workarounds are the cornerstone of a good business continuity plan, which helps firms be more resilient during an emergency. During a crisis or a serious incident, a company has to assume that access to any computing resources could be unavailable for an extended period of time. There is no way of knowing if Sony had business continuity plans that included an extended outage of IT equipment or whether they evoked them, but one thing is clear — most companies do not factor in this type of disaster. Most business continuity planning revolves around localized disasters, such as terrorist attacks, hurricanes and severe weather. The outage that Sony experienced was global, total and extended.
If you manage a department, make sure you have a printed business continuity plan that includes call trees, manual workarounds and information on how to get a hold of each other if company resources are unreachable. Many companies’ plans assume a worst-case scenario consisting of a building or facility being inaccessible, such as a power outage or mandatory evacuation due to a natural disaster, but we are in a new era in which the worst case could be the complete shut-down of all computing equipment. Plan for it.
Defense in Depth
Defense in depth is a concept from the military that has been adopted by many in the cyber-security space. The basic idea is to have rings or layers of defense, rather than putting all your resources in one method. Think of a medieval castle under assault. The defenders are not going to place all of their men in front of the door of the throne room to protect the King. They dig a moat to make it harder to reach the door, raise bridges, close gates, place archers in parapets, pour hot oil on attackers using ladders, strategically deploy swordsmen inside the castle for when it is breached and a special King’s Guard as a last resort.
This method is very effective because if one method of defense fails, there are still others for the attackers to overcome. This also delays the attackers, buying valuable time for the defender to respond.
This technique is used in the cyber-security space in a similar way, as one would deploy resources to defend a castle. Many companies already implement some form of defense in depth, but the Sony hack is a good reminder to audit defenses and ensure you have the right resources in the right places. From outside the network coming in, firewalls and intrusion detection systems (IDS) are deployed. Computers are protected with antivirus and encryption. The most valuable data (in Sony’s case, presumably unreleased movies and internal emails) should be protected with a separate set of firewalls, intrusion detection, etc. — a King’s Guard. Strong company policies and security awareness training are also used as defense measures.

Caerphilly Castle, Caerphilly South Wales
Admittedly, this is a lot — and it is only half of the story. Protecting a company relies just as much on resources outside of the security department as it does resources inside the security department. Do you spend a million dollars a year on security measures but don’t have any method of controlling access to and from your physical building? Can someone waltz in the front door wearing an orange vest and a hardhat and walk off with the CFO’s laptop? Do you encrypt every laptop but don’t perform criminal background checks on employees, consultant and contractors? Maybe you spend a fortune on penetration testing your web sites but don’t do any security checks on vendors that have access to the company network. Target learned this lesson the hard way.
In order to create defense in depth, it is crucial to have the commitment of other departments such as human resources, facilities management, vendor management, communications and others, as they all contribute to the security posture of a company. You can’t rely on your security department to protect the whole company. It truly is a team effort that requires cooperation across all levels in a company. Just like defending a castle. Everyone has a job to do.
Managing Risk
Sony has been criticized for what have been perceived to be lax security measures. Some of the criticism is Monday morning quarterbacking and some of it is valid. In an article for CIO Magazine in 2007, the Executive Director of Sony Pictures Entertainment, Jason Spaltro, was profiled in a cringe-worthy piece called “Your Guide to Good-Enough Security.” In it, Spaltro brags about convincing a SOX auditor not to write up weak passwords as a control failure and explains that it doesn’t make business sense to spend $10 million on fixing a security problem that would only cause $1 million in loss.
He’s right, partly. It doesn’t make sense to spend 10 times more on a problem than the asset is worth. This isn’t a control failure or a problem with perception — this is a risk management problem. The first question a business leader needs to ask is, “Where did you come up with the $1 million in loss figure and is it accurate?” The viewpoint taken by Sony doesn’t fully take into account the different types of losses that a company can experience during a data breach. The Sony breach clearly demonstrates a failure of security controls in several different areas, but the real failure is the firm’s inability to measure and manage risk.
A good risk analysis program identifies an asset, whether it may be employee health information or movie scripts, or even reputation and investor confidence. From there, any threat that can act against an asset is identified, with corresponding vulnerabilities. For example, company intellectual property stored on file servers is a very important asset, with cybercriminals being a well-resourced and motivated threat. Several vulnerabilities can exist at the same time, ranging from weak passwords to access the file server to users that are susceptible to phishing emails that install malware on their systems.
Quantifying Risk
A rigorous risk analysis will take the aforementioned data and run it through a quantitative risk model. The risk analyst will gather data of different types of loss events such as productivity loss, loss of competitive advantage, asset replacement cost, fines, judgments — the list goes on. The final risk assessment will return an annualized exposure. In other words, a data breach could occur once every ten years at a cost of $100 million per incident; therefore, the company has an annualized exposure of $10 million. This makes it very easy for business managers to run a cost benefit analysis on security expenditures. If the analysis is done correctly and sound methods are used, security sells itself.

Components of a risk analysis
In other words, Spaltro is right. You would never spend more on a control than the cost of an incident. However, not all risk is communicated to management in a way that allows for informed business decisions. As a business leader, look at how risk is being communicated to you. Is risk being communicated in a way that makes business decisions easy (dollars) or are softer methods being used, such as, “This vulnerability is a high risk!” (High compared to what? What exactly does High mean?)
In many other aspects of business and in other fields, risk is communicated in terms of annualized exposure and run through a cost-benefit analysis. Information Security, however, is lagging behind and the Sony hack is proof that the field must mature and adopt more advanced methods of quantifying and communicating risk. Decision makers must insist on it.
Conclusion
There are some battles in ancient history that strategists never tire of studying. Lessons and tactics are taught in schools to this day and employed in the battlefield. The Sony Hack will go down in history as one such battle that we will continue to learn from for years to come. Sony had strategic choices to make in the moment and those are continuing to play out in the media, and across the cyber-security landscape. What we can glean from this today is that the firms that are winning are the firms that look at cyber-security on a macro, holistic level. Individual components of successful program are interconnected throughout all aspects of the business, and it is through this understanding that business leaders can stay one step ahead.